7. Netherlands House Prices - insights for UK and Dutch investors
06-11-2004
 There has been much talk in the UK of a future property price crash - the so called "boom-and-bust scenario". However, property has come off the boil without a crash in Ireland, Australia and The Netherlands recently. PropertyInvesting.Net has unearthed definitive data from The Netherlands (all provinces, Kadaster.nl) which show that despite the economy going into recession in 2003 (higher unemployment and GDP growth of -2%) house prices rose slightly in most areas - the boom of 1998 to 2002 did not end in a bust - latest data for 2004 confirms this.
Whether this will be the case in the UK remains to be seen, but with GDP growth at 2.5% and unemployment still falling, it is difficult to see there would be a crash as long as interest rates did not sky-rocket - something which is not expected (base rates are expected to rise to 5.5% in 2005 from 4.5% this month).
The only caveat to this analysis is that The Netherlands mortgage rates are currently only ca. 3.3%, so low borrowing costs and fixed rates have probably helped support prices during a period of economic doldrums. Another point worth noting is that The Netherlands has a similar supply shortage as England and Wales, increasing home ownership and similar demographic growth to the UK.
 |
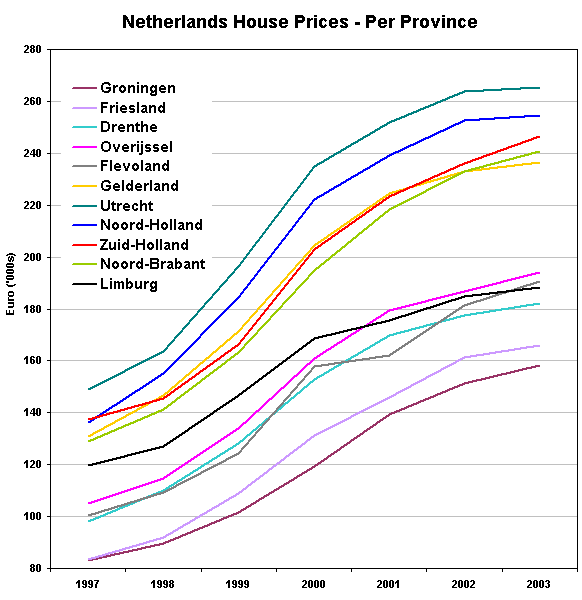 |
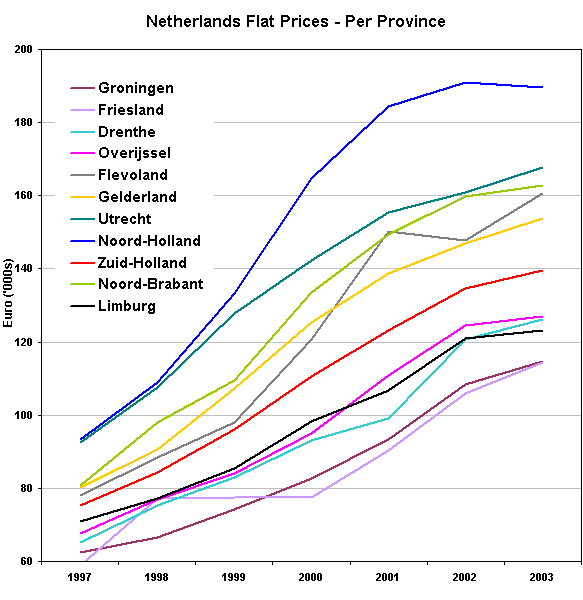
House and Flat Price Increases in Netherlands Provinces 1997-2003
In Euro ('000s)
Source: Kadaster.nl
Groningen
| Year | House | Percentage | Flat | Percentage |
| 1997 | 82.981 | 62.559 | ||
| 1998 | 89.594 | 8,0% | 66.493 | 6,3% |
| 1999 | 101.433 | 13,2% | 74.302 | 11,7 % |
| 2000 | 119.318 | 17,6% | 82.734 | 11,3% |
| 2001 | 139.369 | 16,8% | 93.305 | 12,8% |
| 2002 | 151.355 | 8,6% | 108.503 | 16,3% |
| 2003 | 158.328 | 4,6% | 114.662 | 5,7% |
| Friesland | ||||
| Year | House | Percentage | Flat | Percentage |
| 1997 | 83.521 | 58.804 | ||
| 1998 | 91.877 | 10,0% | 77.296 | 31,4% |
| 1999 | 108.72 | 18,3% | 77.535 | 0,3% |
| 2000 | 131.094 | 20,6% | 77.456 | -0,% |
| 2001 | 145.836 | 11,2% | 90.47 | 16,8% |
| 2002 | 161.471 | 10,7% | 106.06 | 17,2% |
| 2003 | 165.828 | 2,7% | 114.329 | 7,8% |
| Drenthe | ||||
| Year | House | Percentage | Flat | Percentage |
| 1997 | 98.148 | 65.077 | ||
| 1998 | 110.054 | 12,1% | 75.229 | 15,6% |
| 1999 | 128.198 | 16,5% | 83.014 | 10,3% |
| 2000 | 152.85 | 19,2% | 93.221 | 12,3% |
| 2001 | 169.737 | 11,0% | 99.17 | 6,4% |
| 2002 | 177.661 | 4,7% | 120.6 | 21,6% |
| 2003 | 182.084 | 2,5% | 126.295 | 4,7% |
| Overijssel | ||||
| Year | House | Percentage | Flat | Percentage |
| 1997 | 105.171 | 67.753 | ||
| 1998 | 114.575 | 8,9% | 77.038 | 13,7% |
| 1999 | 133.929 | 16,9% | 83.975 | 9,0% |
| 2000 | 161.08 | 20,3% | 94.892 | 13,0% |
| 2001 | 179.376 | 11,3% | 110.859 | 16,8% |
| 2002 | 186.737 | 4,1% | 124.426 | 12,5% |
| 2003 | 194.091 | 3,9% | 127.104 | 2,2% |
| Flevoland | ||||
| Year | House | Percentage | Flat | Percentage |
| 1997 | 100.255 | 78.179 | ||
| 1998 | 109.367 | 9,1% | 88.311 | 13,0% |
| 1999 | 124.397 | 13,7% | 98.129 | 11,1% |
| 2000 | 158.033 | 27,0% | 120.747 | 23,0% |
| 2001 | 162.002 | 2,5% | 150.349 | 24,5% |
| 2002 | 181.506 | 12,0% | 147.708 | 1,8% |
| 2003 | 190.563 | 5,0% | 160.512 | 8,7% |
| Gelderland | ||||
| Year | House | Percentage | Flat | Percentage |
| 1997 | 130.747 | 80.262 | ||
| 1998 | 146.637 | 12,2% | 90.555 | 12,8% |
| 1999 | 171.193 | 16,7% | 107.169 | 18,3% |
| 2000 | 204.333 | 19,4% | 125.349 | 17,0% |
| 2001 | 224.343 | 9,8% | 138.725 | 10,7% |
| 2002 | 232.886 | 3,8% | 146.914 | 5,9% |
| 2003 | 236.386 | 1,5% | 153.775 | 4,7% |
| Utrecht | ||||
| Year | House | Percentage | Flat | Percentage |
| 1997 | 148.844 | 92.583 | ||
| 1998 | 163.762 | 10,0% | 107.477 | 16,1% |
| 1999 | 196.453 | 20,0% | 127.794 | 18,9% |
| 2000 | 234.867 | 19,6% | 142.218 | 11,3% |
| 2001 | 251.773 | 7,2% | 155.53 | 9,4% |
| 2002 | 263.63 | 4,7% | 160.894 | 3,4% |
| 2003 | 265.532 | 0,7% | 167.699 | 4,2% |
| Noord-Holland | ||||
| Year | House | Percentage | Flat | Percentage |
| 1997 | 136.129 | 93.382 | ||
| 1998 | 155.034 | 13,9% | 108.886 | 16,6% |
| 1999 | 184.527 | 19,0% | 133.23 | 22,4% |
| 2000 | 222.028 | 20,3% | 164.739 | 23,7% |
| 2001 | 239.19 | 7,7% | 184.318 | 11,9% |
| 2002 | 252.516 | 5,6% | 190.889 | 3,6% |
| 2003 | 254.435 | 0,8% | 189.605 | -0,7% |
| Zuid-Holland | ||||
| Year | House | Percentage | Flat | Percentage |
| 1997 | 137.408 | 75.179 | ||
| 1998 | 145.389 | 5,8% | 84.224 | 12,0% |
| 1999 | 166.501 | 14,5% | 95.988 | 14,0% |
| 2000 | 202.756 | 21,8% | 110.518 | 15,1% |
| 2001 | 223.377 | 10,2% | 123.034 | 11,3% |
| 2002 | 235.941 | 5,6% | 134.629 | 9,4% |
| 2003 | 246.479 | 4,5% | 139.54 | 3,6% |
| Zeeland | ||||
| Year | House | Percentage | Flat | Percentage |
| 1997 | 88.317 | 64.861 | ||
| 1998 | 94.272 | 6,7% | 82.249 | 26,8% |
| 1999 | 104.804 | 11,2% | 84.678 | 3,0% |
| 2000 | 120.233 | 14,7% | 94.281 | 11,3% |
| 2001 | 136.99 | 13,9% | 109.628 | 16,3% |
| 2002 | 154.425 | 12,7% | 119.236 | 8,8% |
| 2003 | 169.557 | 9,8% | 137.99 | 15,7% |
| Noord-Brabant | ||||
| Year | House | Percentage | Flat | Percentage |
| 1997 | 128.802 | 80.658 | ||
| 1998 | 141.262 | 9,7% | 97.906 | 21,4% |
| 1999 | 163.226 | 15,5% | 109.445 | 11,8% |
| 2000 | 194.698 | 19,3% | 133.533 | 22,0% |
| 2001 | 218.209 | 12,1% | 149.46 | 11,9% |
| 2002 | 232.813 | 6,7% | 159.937 | 7,0% |
| 2003 | 240.583 | 3,3% | 162.724 | 1,7% |
| Limburg | ||||
| Year | House | Percentage | Flat | Percentage |
| 1997 | 119.826 | 70.951 | ||
| 1998 | 127.121 | 6,1% | 77.288 | 8,9% |
| 1999 | 146.765 | 15,5% | 85.541 | 10,7% |
| 2000 | 168.516 | 14,8% | 98.194 | 14,8% |
| 2001 | 175.393 | 4,1% | 106.858 | 8,8% |
| 2002 | 184.957 | 5,5% | 120.846 | 13,1% |
| 2003 | 188.433 | 1,9% | 123.135 | 1,9% |
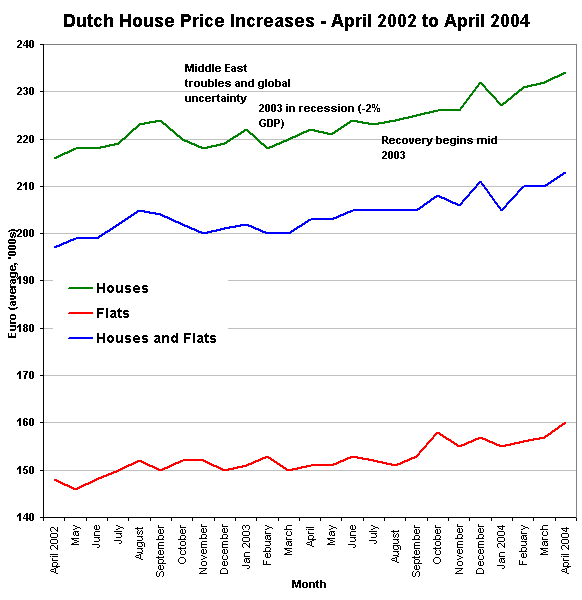
The house prices up to April 2004 show a steady rise in price - with a two year average for both flats of 8.3% and house 8.1%. There are not signs as yet of a house price crash - rather the market has cooled and is now rising at a far slower pace of 4% per annum as compared to 10-25% in previous years.
| Latest Dutch House Price Increases (up to end April 2004) | |||||||
| Source: Kadaster.nl | |||||||
| Houses | Flats | Houses and Flats | |||||
| Year | Month | Purchase Price | Number ('000s) | Purchase Price | Number ('000s) | Purchase Price | Number ('000s) |
| x 1000 EUR | x 1000 EUR | x 1000 EUR | |||||
| 2004 | April | 234 | 11.757 | 160 | 4.732 | 213 | 16.489 |
| 2004 | March | 232 | 11.032 | 157 | 4.582 | 210 | 15.614 |
| 2004 | Febuary | 231 | 9.489 | 156 | 3.798 | 210 | 13.287 |
| 2004 | January | 227 | 7.157 | 155 | 3.169 | 205 | 10.326 |
| 2003 | December | 232 | 17.974 | 157 | 6.664 | 211 | 24.638 |
| 2003 | November | 226 | 10.892 | 155 | 4.264 | 206 | 15.156 |
| 2003 | October | 226 | 12.699 | 158 | 4.644 | 208 | 17.343 |
| 2003 | September | 225 | 12.308 | 153 | 4.498 | 205 | 16.806 |
| 2003 | August | 224 | 11.864 | 151 | 4.171 | 205 | 16.035 |
| 2003 | July | 223 | 12.946 | 152 | 4.544 | 205 | 17.49 |
| 2003 | June | 224 | 10.575 | 153 | 3.854 | 205 | 14.429 |
| 2003 | May | 221 | 12.295 | 151 | 4.368 | 203 | 16.683 |
| 2003 | April | 222 | 11.033 | 151 | 4.111 | 203 | 15.144 |
| 2003 | March | 220 | 10.282 | 150 | 4.065 | 200 | 14.347 |
| 2003 | Febuary | 218 | 9.724 | 153 | 3.663 | 200 | 13.387 |
| 2003 | January | 222 | 8.438 | 151 | 3.385 | 202 | 11.823 |
| 2002 | December | 219 | 15.841 | 150 | 5.47 | 201 | 21.311 |
| 2002 | November | 218 | 11.568 | 152 | 4.236 | 200 | 15.804 |
| 2002 | October | 220 | 11.841 | 152 | 4.348 | 202 | 16.189 |
| 2002 | September | 224 | 11.425 | 150 | 4.21 | 204 | 15.635 |
| 2002 | August | 223 | 12.657 | 152 | 4.493 | 205 | 17.15 |
| 2002 | July | 219 | 14.849 | 150 | 4.966 | 202 | 19.815 |
| 2002 | June | 218 | 11.761 | 148 | 4.207 | 199 | 15.968 |
| 2002 | May | 218 | 12.962 | 146 | 4.607 | 199 | 17.569 |
| 2002 | April | 216 | 10.613 | 148 | 3.931 | 197 | 14.544 |
| 2 yr % increase | 8.3% | 8.1% | 8.1% | ||||
Prices have been fairly steady, though they did drop September 2002 to April 2003 during a period of Middle East troubles, global uncertainty and SARS. This also corresponded to a brief recession in Holland and slowdown in the USA. Prices since September 2003 have started rising robustly, particularly for flats - this is probably driven by low interest rates, a moderate pick-up in the economy and shortage of supply for property. Growth in 2003 in Zeeland and Zuid Holland (Rotterdam/The Hague) was particularly strong.
 |
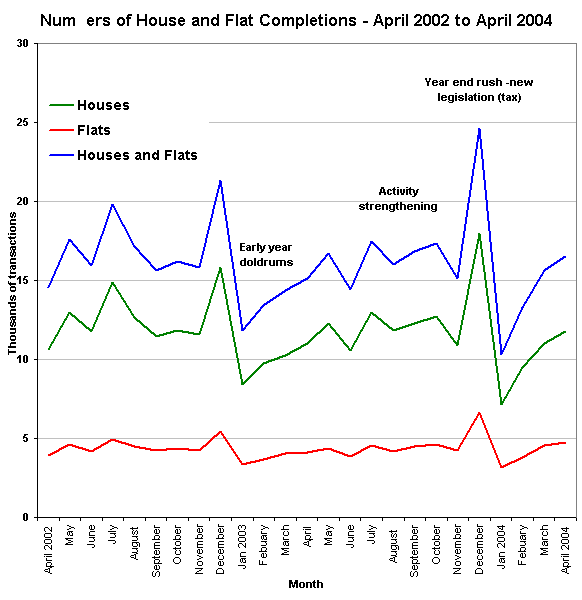
Transactions are rising in 2004 though this is a seasonal trend - the amount of transaction is still lower than in mid 2002. This is probbaly because the economy has just come out of recession - activity levels are not high.
|

