525: Oil Price Modelling and Impact on Property Investment
01-01-2015
PropertyInvesting.net team
Oil prices continue to crash. Oil prices have dropped from $102/bbl in August to close to half - which is $52/bbl by 31 Dec 2014. As regular visitors to PropertyInvesting.net website will understand, oil prices have a huge impact on the global economy and hence property prices. When oil prices rise in all oil importing nations, it acts like a huge drain or tax on incomes, and less money is available for normal economic growth, consumer spending and property purchases. High oil prices in most developed nations lead to "stagflation".
Meanwhile when oil prices drop, it's like a huge tax giveaway which stimulates consumer spe nding, keeps a lid on general inflation (of fuel and food) and this then feeds rapidly through to boosting property prices.
For property investors, the trick at the moment is to avoid large oil producing areas or countries that will have a dramatically reduced revenue stream for the next year or so. Property prices in such areas should come under pressure and likely drop.
Property investors should instead look at snapping up bargain in areas that have previously suffered from high oil prices like north-eastern parts of USA and California and South Korea.
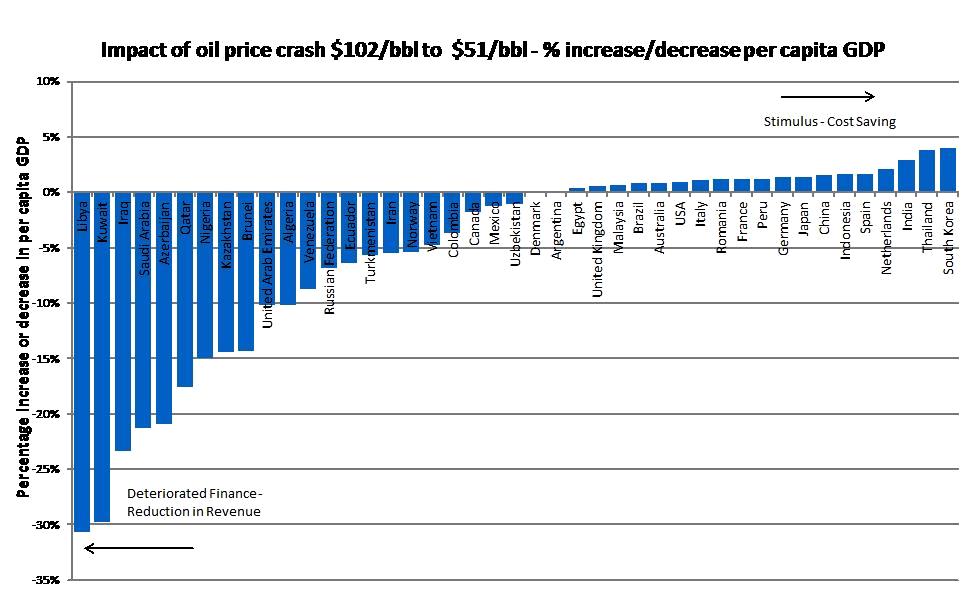
Modelling: We have also added each nation's population and GDP (2012$, around $100/bbl). We have also added the annual per capita in dollars (per person). If we then divide the loss-gain by the per capita, we get a % reduction or increase in per capita. This is a pretty good proxy for a fiscal tax stimulus (benefit) or fiscal tax burden (loss) per person.
What is shows for example is that each Saudi citizen would long term see a -21% loss in their living standard. Each Libyan would see a massive -31% loss in living standards. However, each Chinese would see a +2% increase (like a 2% tax give away) and each South Korean would see a +4% increase.
Another example is Russia, which will see per capita revenue drop by a large -6% because the economy is so reliant on oil revenues. This is therefore modelled to undoubtedly lead to a recession in Russia in 2015. Property prices will therefore drop sharply in dollar terms (even in the last few months, they have dropped by an equivalent 40% in dollar terms because the Rouble currency has crashed so sharply.

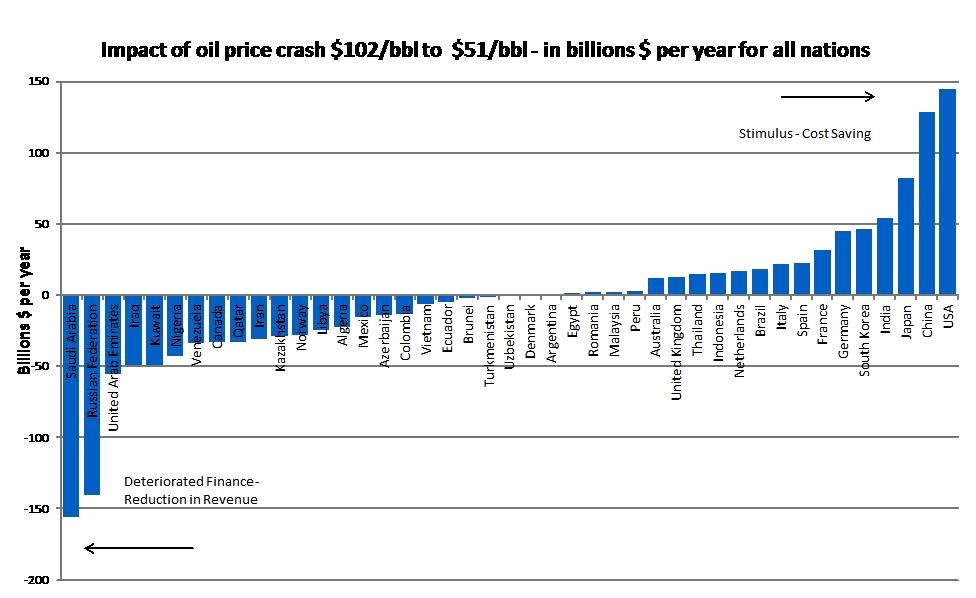
The chart below shows the actual dollar increase or decrease in cost or revenues in different countries - in billions of dollars a year. What this chart clearly shows is that - for example:
- Japan has a stimulus of $82 billion
- USA has a stimulus of $145 billion
- China has a stimulus of $128 billion
- Saudi Arabia has a reduction in revenue of -$156 billion
- Russia has a reduction in revenue of -$140 billion
It doesn't take a rocket scientist to deduce that property prices in Japan and USA should rise along with economic stimulus-growth - whilst Russia and Saudi Arabia will see large drops and a recession.
Venezuela will see a drop of $33 billion in revenue in a small struggling economy highly dependant on oil revenues with a gigantic state public sector. Frankly Venezuela is predicted to have a collapsing economy in 2015 - default and strife if oil prices stay at $50-$60/bbl. Property investors should steer well clear of Venezuela. Iran will also see a $31 billion drop in revenues which should put further pressure on inflation as the currency declines and lead to far lower standard of living in Iran.
The UK should see a stimulus of a fairly meagre £12 billion. Oil companies will be hard hit in Aberdeen and London. The Treasury tax receipts will drop, but the economy should be boosted overall. Aberdeen should see property prices dropping sharply by about 10% in 2015, meanwhile house prices in England should be stimulated by lower general inflation, lower mortgage lending costs and improving employment prospects - as long as Labour win power in May 2015.

At $51/bbl average in a year instead of $102/bbl (halving of oil price)
| Country | Loss/Gain $ Bln/year at $51/bbl |
| Saudi Arabia | -155.59 |
| Russian Federation | -140.23 |
| United Arab Emirates | -54.96 |
| Iraq | -48.96 |
| Kuwait | -48.90 |
| Nigeria | -42.35 |
| Venezuela | -33.10 |
| Canada | -32.78 |
| Qatar | -32.61 |
| Iran | -30.85 |
| Kazakhstan | -28.73 |
| Norway | -27.62 |
| Libya | -24.26 |
| Algeria | -21.99 |
| Mexico | -15.91 |
| Azerbaijan | -14.37 |
| Colombia | -13.75 |
| Vietnam | -6.51 |
| Ecuador | -5.31 |
| Brunei | -2.34 |
| Turkmenistan | -1.80 |
| Uzbekistan | -0.56 |
| Denmark | -0.01 |
| Argentina | 0.11 |
| Egypt | 0.95 |
| Romania | 1.84 |
| Malaysia | 2.02 |
| Peru | 2.36 |
| Australia | 11.74 |
| United Kingdom | 12.59 |
| Thailand | 14.23 |
| Indonesia | 14.91 |
| Netherlands | 16.22 |
| Brazil | 17.64 |
| Italy | 21.64 |
| Spain | 22.34 |
| France | 31.02 |
| Germany | 44.78 |
| South Korea | 45.79 |
| India | 53.76 |
| Japan | 82.17 |
| China | 127.97 |
| USA | 144.68 |
| Country | Proportional Gain/Loss per person % |
| Libya | -30.6% |
| Kuwait | -29.8% |
| Iraq | -23.3% |
| Saudi Arabia | -21.2% |
| Azerbaijan | -20.9% |
| Qatar | -17.5% |
| Nigeria | -15.0% |
| Kazakhstan | -14.3% |
| Brunei | -14.3% |
| United Arab Emirates | -10.3% |
| Algeria | -10.2% |
| Venezuela | -8.8% |
| Russian Federation | -6.9% |
| Ecuador | -6.4% |
| Turkmenistan | -5.7% |
| Iran | -5.6% |
| Norway | -5.5% |
| Vietnam | -4.8% |
| Colombia | -3.7% |
| Canada | -1.8% |
| Mexico | -1.3% |
| Uzbekistan | -1.1% |
| Denmark | 0.0% |
| Argentina | 0.0% |
| Egypt | 0.4% |
| United Kingdom | 0.5% |
| Malaysia | 0.7% |
| Brazil | 0.8% |
| Australia | 0.8% |
| USA | 0.9% |
| Italy | 1.1% |
| Romania | 1.2% |
| France | 1.2% |
| Peru | 1.2% |
| Germany | 1.3% |
| Japan | 1.4% |
| China | 1.6% |
| Indonesia | 1.6% |
| Spain | 1.6% |
| Netherlands | 2.1% |
| India | 2.9% |
| Thailand | 3.8% |
| South Korea | 3.9% |


