434: Country Ranking - Resources Model - Risk-Opportunity
07-06-2012
PropertyInvesting.net team
In this Special Report we have ranked each country based on the oil export (surplus) or import (deficit) as a proportion of the country’s GDP, then additionally taken into consideration key macro-economic country criteria to prepare a qualitative listing of countries - to guide country investment decisions, and to high key risk countries for property investment.
 The trigger for this analysis has been the commodities boom that has taken hold in the last eight years, caused in part by the boom in demand from
It's obviously very hard to predict overall future outcomes, and our Special Report 199 highlights this in describing contagion affects and lack of predictability of outcomes. That said, what we have attempted to perform is a form of risk assessment, coupled with colour coding key economic criteria to highlight a countries key strengths.
The criteria are colour coded to make it easier for you to absorb the analysis. The chart is relevant as long as oil, gas and coal/power prices remain relatively high -and as our regular visitors are aware, we believe they will remain high and this chart therefore becomes more relevant in future years to manage investment risks.
In summary, with such high commodities prices, an ideal country would have:
- Oil: Huge oil production and exports (coloured column 1)
- Gas: Huge gas production and exports (coloured column 2)
- Coal-Power: Huge coal-power-nuclear-hydro production and exports (coloured column 3)
- Manufacturing: Highly efficient and low cost manucturing using latest technology or human capital (coloured column 4)
- Financial services: Highly efficient, innovative, high technology financial and business services using knowledgable-highly educated workforce (coloured column 5)
- Security: High internal country and regional security with little secruity threat (coloured column 6)
- Demographics: Expanding population - non aging workforce, though not too many young people within social fabric of country (coloured column 7)
| Overall Country Ranking - note: Oil Surplus Deficit @ $100/bbl as a percentage of GDP | |||||||||||||
| Country |
2011 Surplus/ Deficit $bln |
2011 GDP $bln | 2011 GDP $bln | % GDP | Oil | Gas | Coal or Hydro-other | Maufac-turing | Financial Services | Security | Demo-graphics | Overall rating | |
| Iraq | 85.5 | 2342 | 150 | 57.0% | |||||||||
| Saudi Arabia | 303.1 | 8305 | 578 | 52.5% | |||||||||
| Kuwait | 88.6 | 2427 | 177 | 50.1% | |||||||||
| Azerbaijan | 31.1 | 851 | 70 | 44.4% | |||||||||
| Nigeria | 89.7 | 2457 | 239 | 37.5% | |||||||||
| Kazakhstan | 59.4 | 1628 | 178 | 33.3% | |||||||||
| Qatar | 54.2 | 1485 | 174 | 31.2% | |||||||||
| UAE | 96.8 | 2651 | 360 | 26.9% | |||||||||
| Algeria | 50.5 | 1384 | 191 | 26.5% | |||||||||
| Libya | 11.2 | 307 | 50 | 22.4% | |||||||||
| Venezuela | 68.9 | 1888 | 316 | 21.8% | |||||||||
| Iran | 91.1 | 2497 | 482 | 18.9% | |||||||||
| Brunei | 6.1 | 166 | 35 | 17.3% | |||||||||
| Russian Federation | 267.2 | 7319 | 1850 | 14.4% | |||||||||
| Norway | 65.2 | 1787 | 484 | 13.5% | |||||||||
| Ecuador | 10.3 | 282 | 120 | 8.6% | |||||||||
| Turkmenistan | 3.9 | 108 | 50 | 7.9% | |||||||||
| Colombia | 24.7 | 677 | 328 | 7.5% | |||||||||
| Vietnam | 12.0 | 328 | 162 | 7.4% | |||||||||
| Mexico | 33.2 | 911 | 1155 | 2.9% | |||||||||
| Canada | 44.8 | 1228 | 1737 | 2.6% | |||||||||
| Denmark | 1.9 | 51 | 333 | 0.6% | |||||||||
| Egypt | 0.9 | 26 | 236 | 0.4% | |||||||||
| Argentina | -0.1 | -2 | 448 | 0.0% | |||||||||
| Malaysia | -1.3 | -35 | 279 | -0.5% | |||||||||
| UK | -16.1 | -442 | 2418 | -0.7% | |||||||||
| Brazil | -16.8 | -460 | 2493 | -0.7% | |||||||||
| Peru | -1.8 | -50 | 230 | -0.8% | |||||||||
| Romania | -3.6 | -99 | 300 | -1.2% | |||||||||
| Australia | -18.9 | -519 | 1488 | -1.3% | |||||||||
| Indonesia | -17.8 | -489 | 846 | -2.1% | |||||||||
| France | -62.9 | -1724 | 2776 | -2.3% | |||||||||
| Italy | -50.2 | -1376 | 2199 | -2.3% | |||||||||
| Germany | -86.2 | -2362 | 3577 | -2.4% | |||||||||
| Ireland | -5.2 | -142 | 206 | -2.5% | |||||||||
| USA | -401.3 | -10994 | 15094 | -2.7% | |||||||||
| Japan | -161.3 | -4418 | 5869 | -2.7% | |||||||||
| China | -206.9 | -5668 | 7298 | -2.8% | |||||||||
| Spain | -50.8 | -1392 | 1494 | -3.4% | |||||||||
| Greece | -12.5 | -343 | 303 | -4.1% | |||||||||
| Netherlands | -38.4 | -1052 | 840 | -4.6% | |||||||||
| India | -95.4 | -2614 | 1676 | -5.7% | |||||||||
| Uzbekistan | -3.3 | -91 | 50 | -6.7% | |||||||||
| Thailand | -26.8 | -735 | 346 | -7.8% | |||||||||
| South Korea | -87.5 | -2397 | 1116 | -7.8% | |||||||||
| Legend | |||||||||||||
| Very high rating | |||||||||||||
| High rating | |||||||||||||
| Medium rating | |||||||||||||
| Low-medium rating | |||||||||||||
| Low rating | |||||||||||||
Because of the 1000% increase in oil prices from 1999 ($10/bbl) to 2011 ($100/bbl) we have highlighted the overall surplus or deficit of oil as a percentage of overall country GDP (2011). The reason for highlighting oil is that this is a KEY CHANGE in the global economic landscape in the last 10  years that will continue to dictate future outcomes of wealth distribution, and hence property price / asset increases in respective countries. Where this is economic change – positive or negative, there will normally be property asset price changes. If incomes rise, property prices rise.
Overall cost of oil imports in the world at $100/bbl is $1.36 Trillion per annum ($0.4 Trillion is to the
We have then given an overall rating. Ideally, look for dark green or light green - those are the countries with everything working positively for them with high oil/gas/coal prices. And one would tend to avoid countries with too much red. A country with massive % GDP oil deficit, no oil/gas/coal/power, high cost low efficiency manufacturing, poor financial services and an aging population with security threats would rank the lowest (Italy and Greece spring to mind). It would not be wise to execute property investing in such a country.
To highlight a few countries you might be interested in:
 Nuclear power still account for ca. 20% of power requirements. Renewable energy is increasing from a very low base. A lot of the global oil, gas and mining wealth also comes back to
Overall, despite the weakening economy and high taxes, the
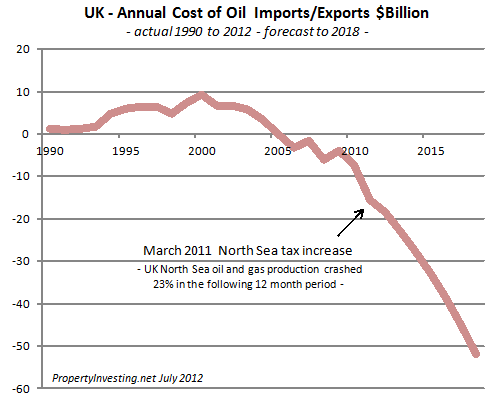
One big negative though is the UK oil production crash. The Chancellor hiked North Sea taxes in March 2011 in a surprize move that it seems not even the UK Energy Minister knew anything about. 12 months later the oil and gas production had crashed 22% (decline rates has been 5% before then). Oil import bills have skyrocketted. The government really shot itself in the foot because - overall North Sea tax revenues have dropped after just 12 months of this new tax, and tax take on corporate profits have dropped dramatically as oil production has dropped in declining-struggling fields.

USA: The oil deficit situation for the USA looks bleak - at present the country is spending $400 billion on importing oil per annum, compared to it's GDP(2011) of $15,200 billion - a large 2.7% of it's overall GDP. This is like slapping an additional tax rate of about double this amount at 5.4% on the economy as a whole (all goods and services). This acts as a drag on the economy on an annual basis - and the  of it. Standards of living drops to compensate for high oil import costs. Currency re-adjustment might help the deficit, but oil imports will have a very negative long term impact. The faster transportation innovation develops the better - what we're talking about here energy conservation and efficiency savings, more renewables projects (possibly wind, solar), electric cars, natural gas powered car and (clean) coal-electric plant expansion. But the good news for the
Looking foward to 2013, things look very bleak for the US economy:
- Legally binding spending cuts start
- Legally binding tax increases start
- President Obama will be re-elected - healthcare costs will rise further and money printing fueling inflation
- More money, profits, savings and employment move offshore - tax take will reduce further
- Iran is likely to be a real issue by then
- The stagnation of 2012 will turn into a major recession in 2013
- The Bond Market bubble is likely to pop - interest rates will rise as the dollar declines and a financial meltdown is quite possible
PIIGs: If you review the tabulation above, its little surprize that Greece, Portugal, Italy and Ireland are all in trouble with high debt, large deficits and semi-bankrupt governments. All these countries import gigantic quantities of oil, gas, coal whilst they are not leaders in manufacturing, do not lead in financial services and have an aging and decline population (more old people to support, less young workers). This analysis clearly shows the challenges these countries have to remain wealthy as oil prices rise further.
The highlights are Canada, Australia and Norway. Norway in particualar has almost everything going for it:
- gigantic oil exports per person (new oil finds should help arrest the decline after 3-5 years)
- gigantic gas exports
- highest ranking in Transparency International for honest business-ethics
- large land area
- low cost hydro-electric power
- well managed sovereign wealth fund
- no European liabilities - not in the EU or Euro currency
- increasing population
- high levels of women workers - also in senior positions (good day care)
- high GDP activity levels in the winter (so dark, nothing better to do than work!)

