432: Oil Production Consumption - Surplus/Deficit - Modelling - Insights For Investors
06-20-2012

PropertyInvesting.net team
We have prepared this unique oil production, consumption, export, import and surplus, deficit modelling for all countries in the world from 1965 to 2011 and forecast to 2018. This is the only such work in the world. The reason why we have gone to such lengths to prepare this, is that we wish to share key insights into the economic world we live in - to help investors focus their capital in the right place at the right time. As a guide, the countries that will do best economically - and hence will have higher returns will be those that have:
- oil exports
- increasing oil exports
- small populations
- good efficient manufacturing and financial services industries
- high security, safety, low crime and high standards of goverance, transparency with little corruption
The analysis below will give you insights into 1, 2 and 3. When you also consider 4 and 5 - the top countries are:
- Canada
- Australia
- Norway
Expect these countries to have a strengthening currencies, balance of payments surpluses, low unemployment and rising property prices in the longer term.
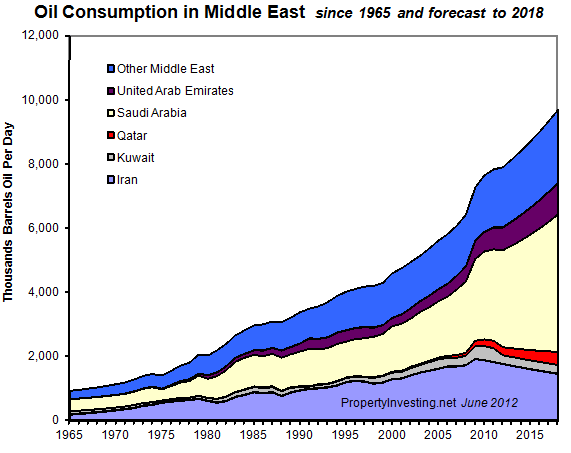
If you are looking within a region, it will not take a rocket scientist to see that Kuwait and Qatar will be the big winners in the next 20 years.
We suggest you browse the presentation and use it as a reference document when you chose a country to invest in. As you can see, countries like Spain and Italy have massive oil import bills - which partly explains why they have such high deficits and have large government debts after ten years of high oil prices inflicting pain - leading the the Euro crisis.
The oil production and consumption modelling is built up from each individual country in a database - along with population, actual and forecast oil prices and forecast oil consumption and production from 2011 to 2018. As you can imagine, it's not been easy putting this mathematical-technical and analysitical model together. We hope you find it insightful. And it helps with your investments whatever and wherever they may be.
_________________________________________________________________
Oil Production Global All Liquids
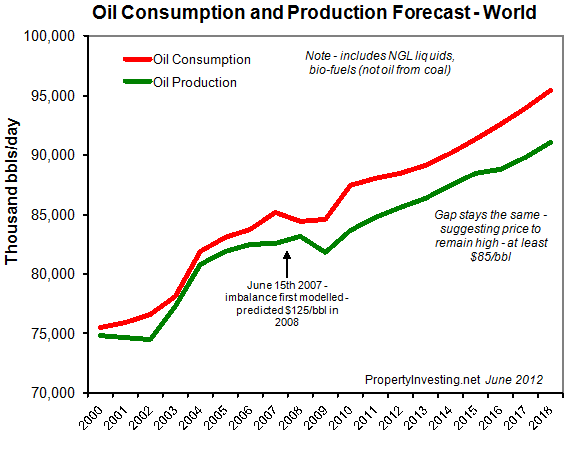
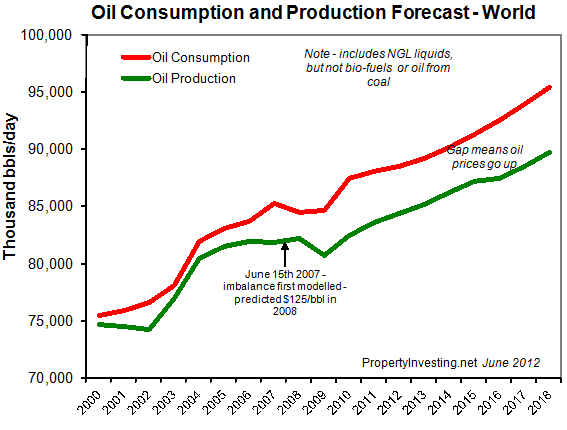
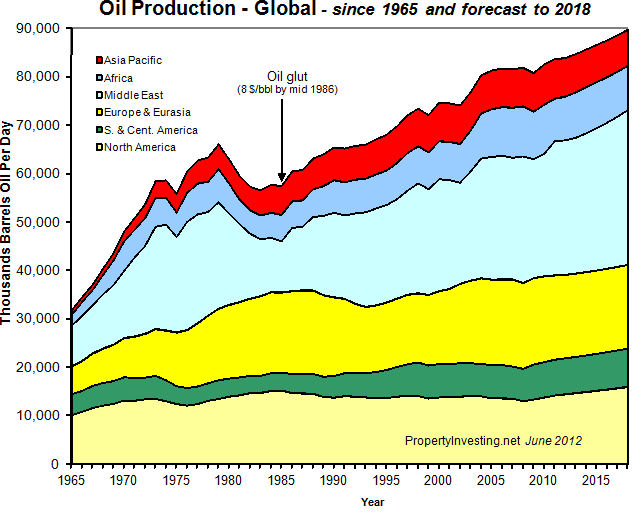
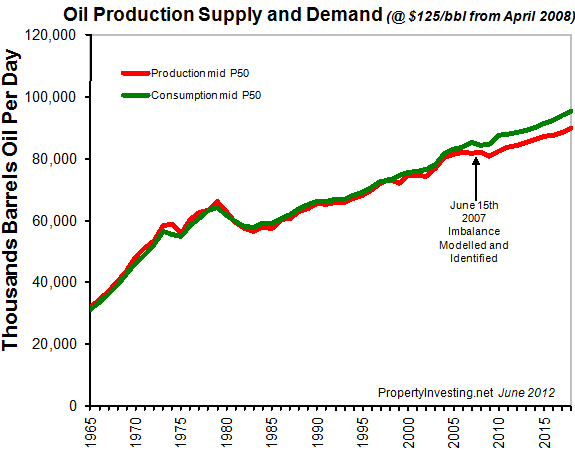
The below chart is a key one. It shows continued global consumption growth, but production lags behind, consistently since we noticed an abnormality June 2007. the good news is supply keeps rising, The bad news is consumption rises just as fast. This chart also includes bio-fuels which is increasing in supply as well. What it means is that oil prices should stay above $85/bbl - but its quite possible they will be kept below $150/bbl for a while as new supplies come on-stream. The supply crunch seen a few years ago has partly worked its way out because all countries are drilling like crazy to take advantage of high oil prices. Supply really is increasing now. But this can be set back by supply disruptions such as Iran, Sudan etc.
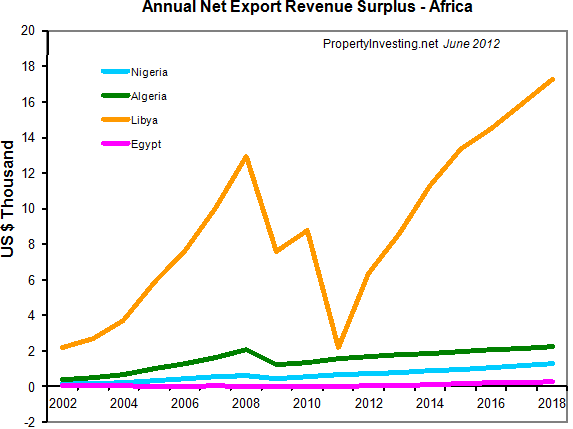
Annual Net Export Revenue Surplus Africa
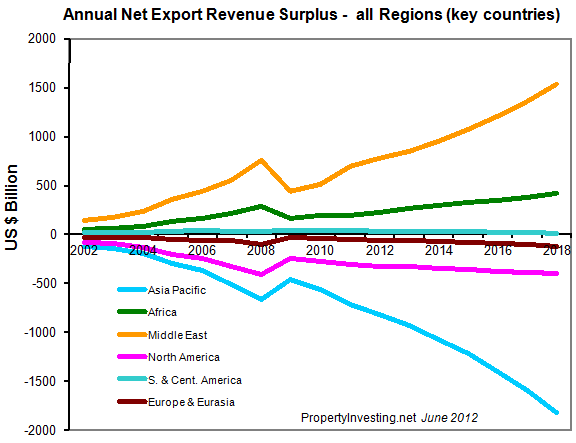
Annual Net Export Revenue Surplus - All Regions Key Countries
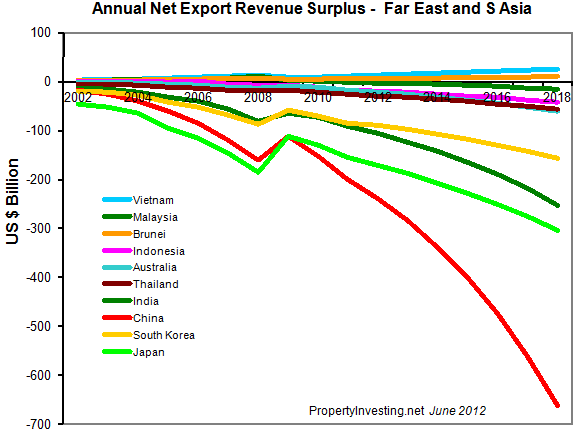
Annual Net Export Revenue Surplus - Far East And South Asia
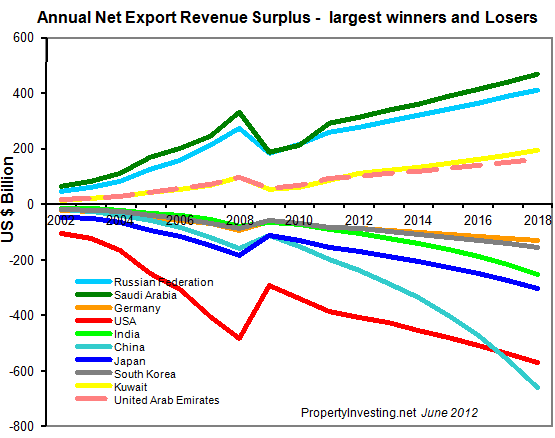
Annual Net Export Revenue Surplus - Largest Winner And Losers
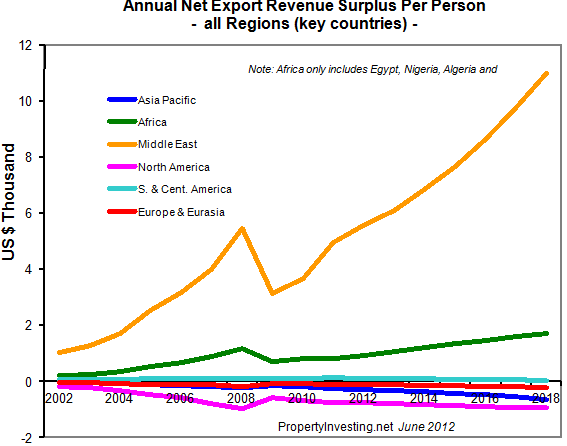
Annual Net Export Revenue Surplus Per Person - All Regions
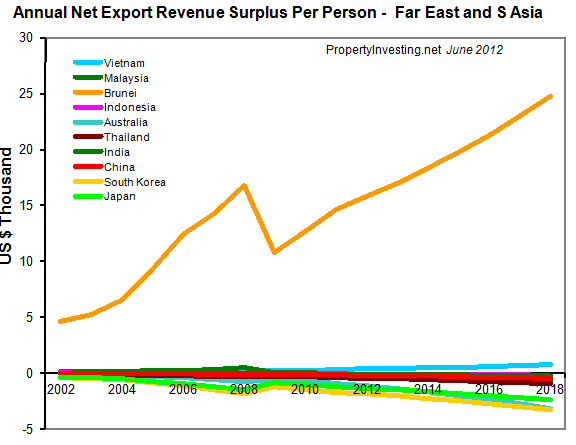
Annual Net Export Revenue Surplus Per Person - Far East And South Asia
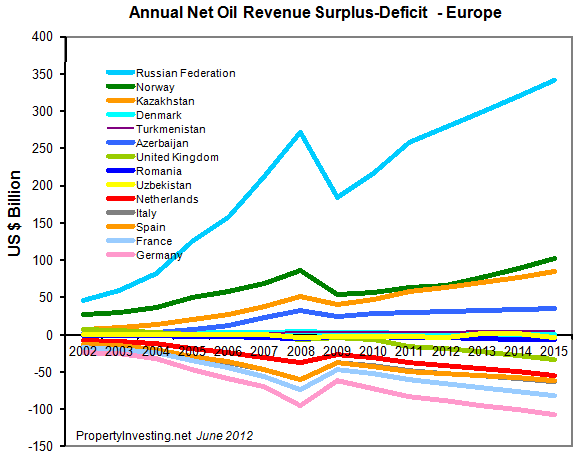
Annual Net Export Revenue Surplus Per Person - Largest Winners And Losers
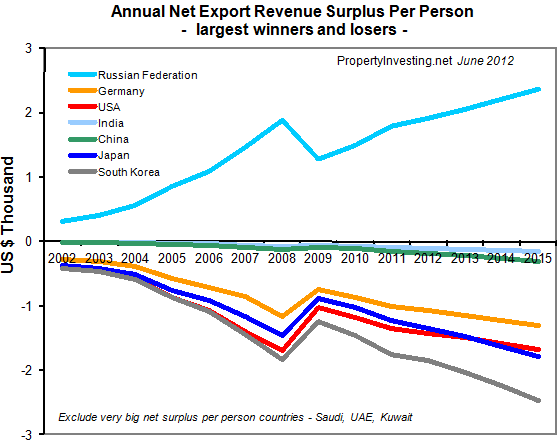
Annual Net Export Revenue Surplus Per Person -Largest Winners And Losers
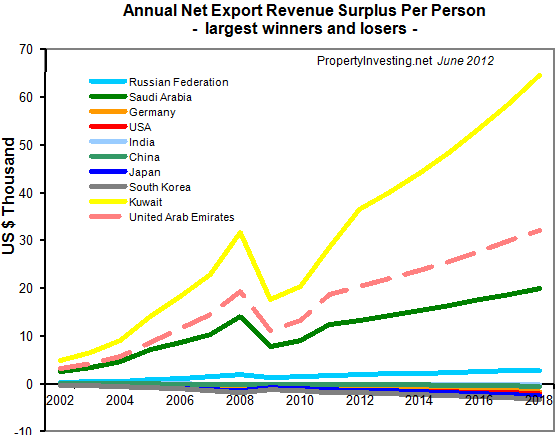
Annual Net Export Revenue Surplus Per Person Per Year - All Regions
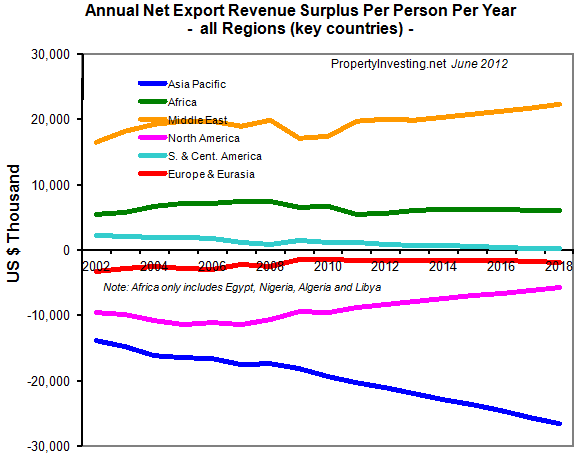
Annual Net Oil Revenue Surplus/Deficit - Europe
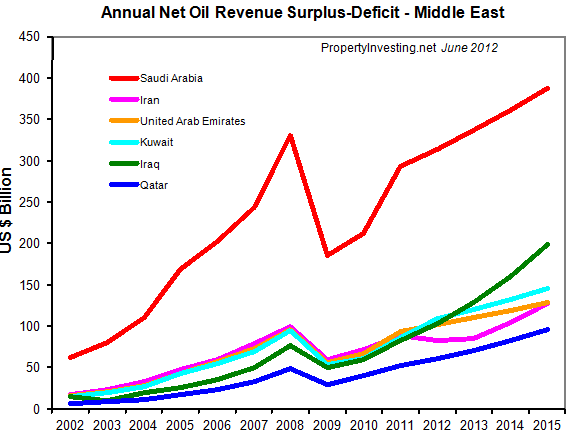
Annual Net Oil Revenue Surplus/Deficit - Middle East
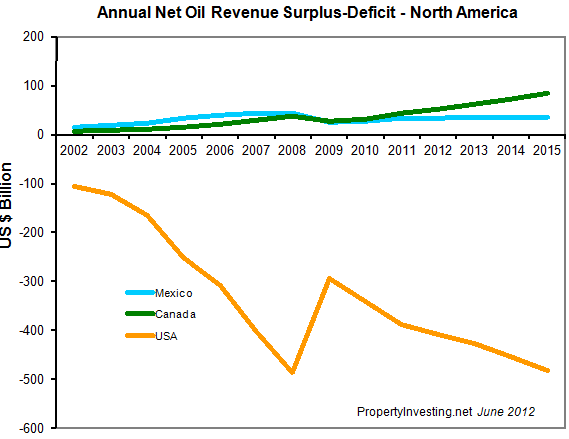
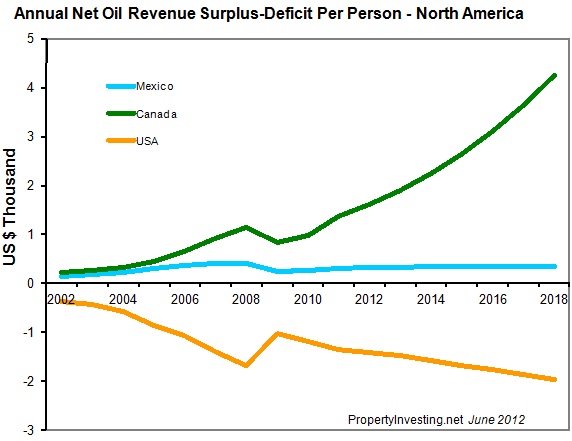
Annual Net Oil Revenue-Surplus/Deficit - North America
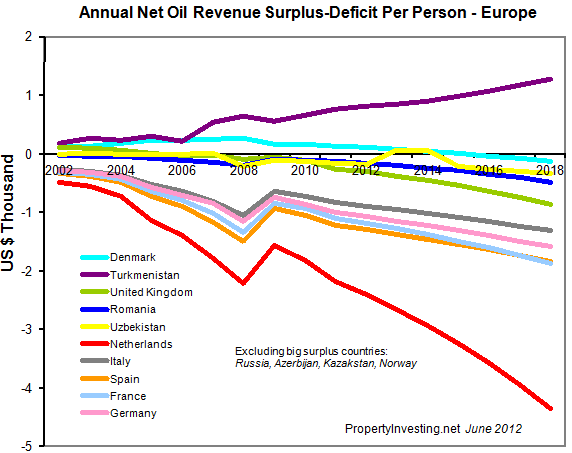
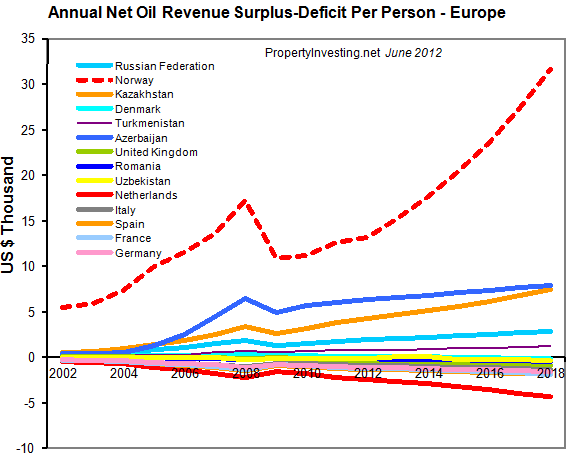
Annual Net Oil Revenue Surplus/Deficit Per Person - Europe
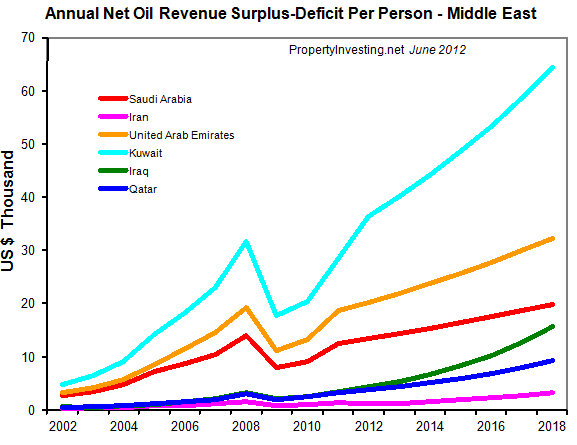
Annual Net Oil Revenue Surplus/Deficit Per Person - Middle East
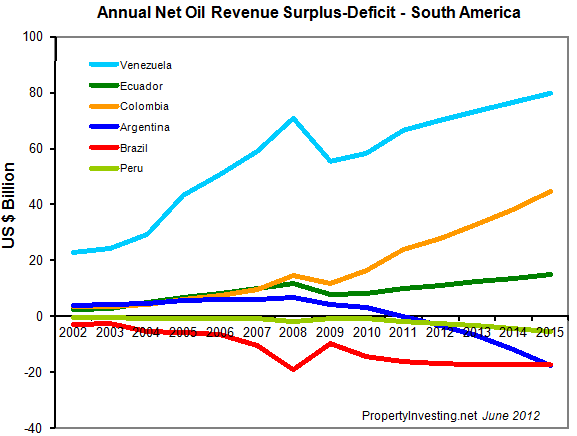
Annual Net Oil Revenue Surplus/Deficit - South America
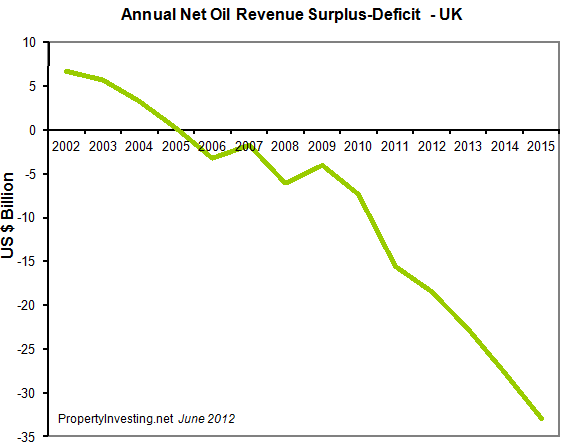
Annual Net Oil Revenue Surplus/Deficit - UK
Production crashes from 2002 - accelerating after tax increased in 2003 and 2011 - rendering large tracts of the North Sea sub-economic despite increasing oil prices due to hugely increasing UK government tax take
Annual Net Oil Revenue Surplus Per Person - North America
Annual Net Oil Surplus/Deficit Per Person - Europe
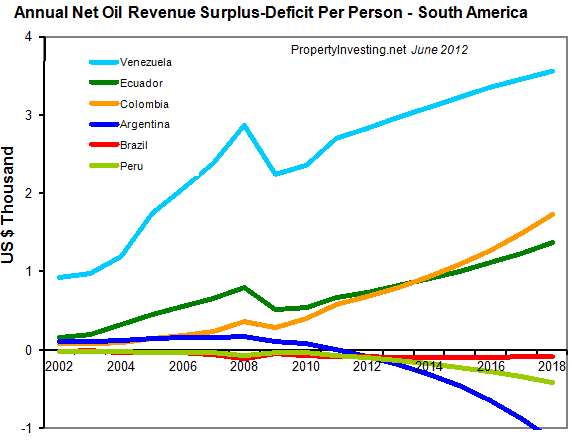
Annual Net Revenue Surplus/Deficit Per Person - South America
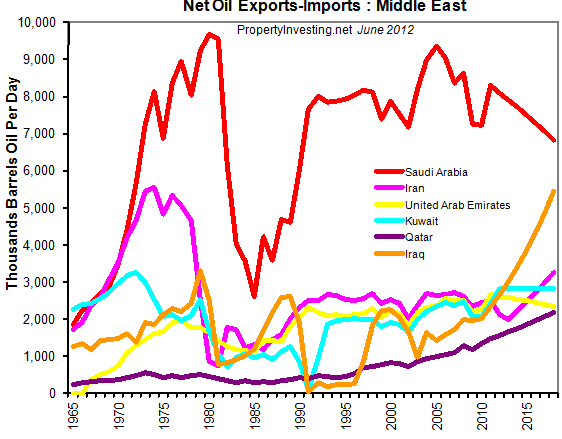
Daily Net Oil Export Forecast - Middle East
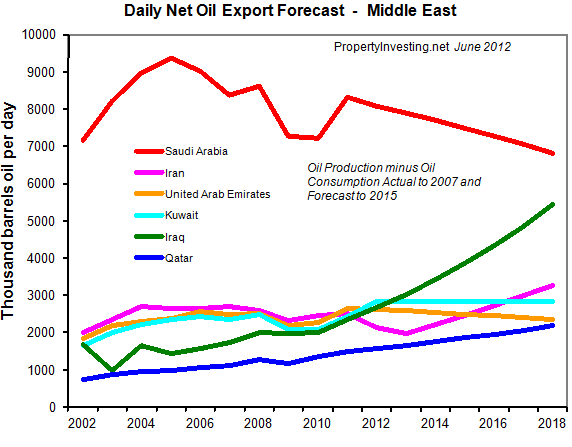
Daily Net Oil Export Forecast - Middle East

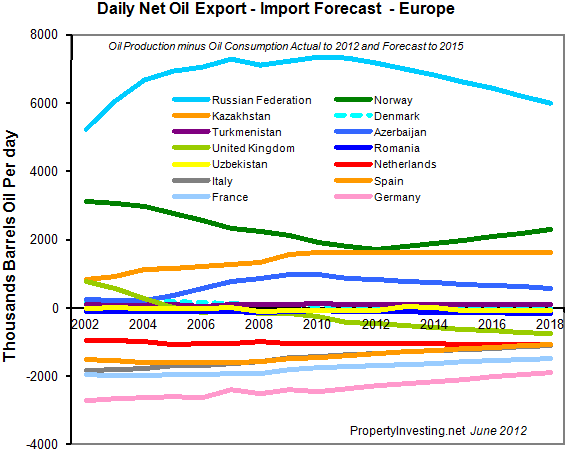
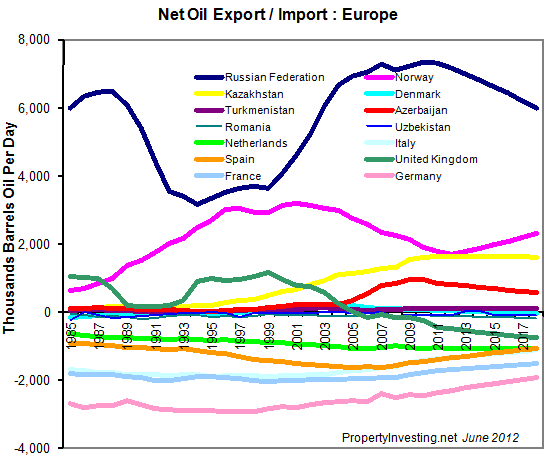
Daily Net Oil Export Import Forecast - Europe
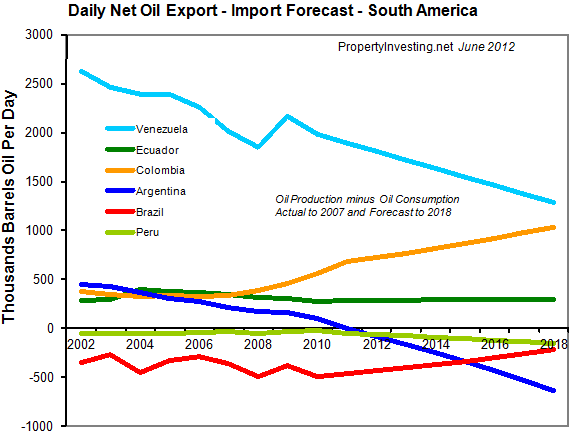
Daily Net Oil Export Import Forecast - South America
Daily Net Oil Import Export Forecast - Africa
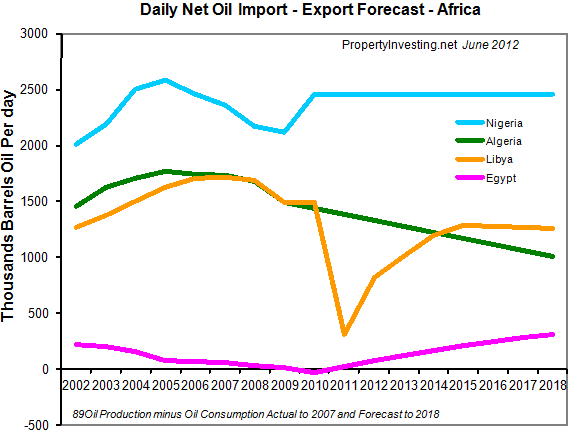
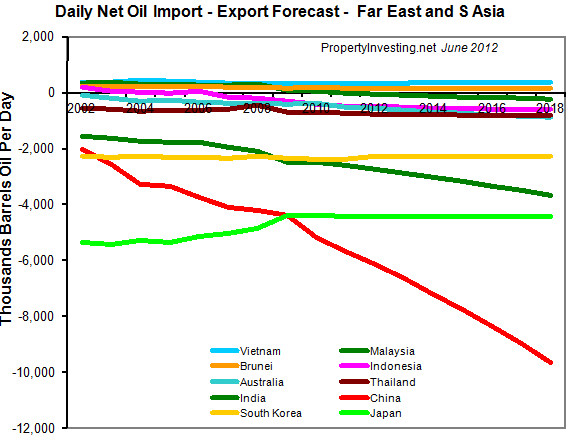
Daily Net Oil Import Export Forecast Far East And South Asia
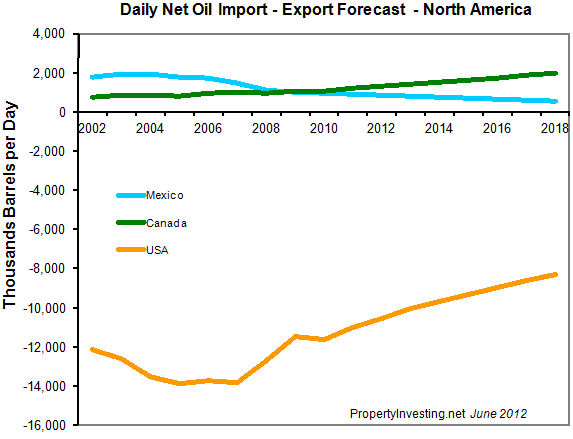
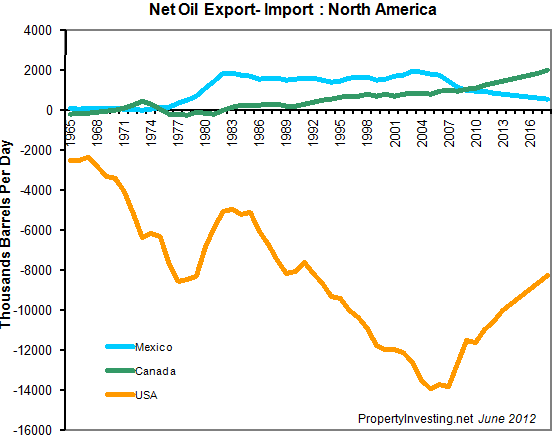
Daily Net Oil Import Export Forecast - North America
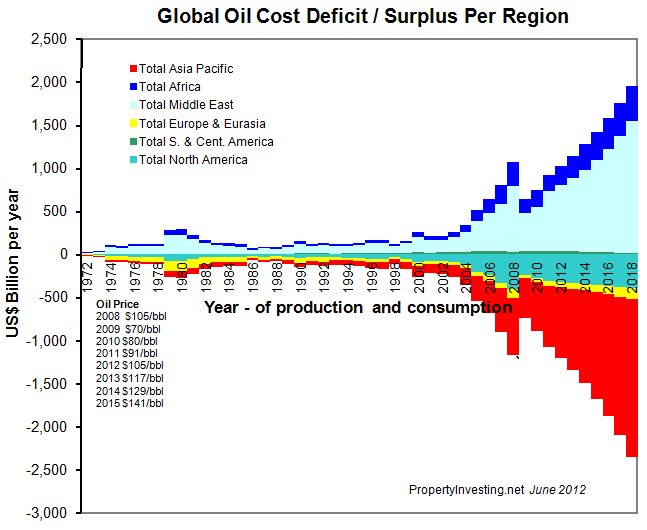
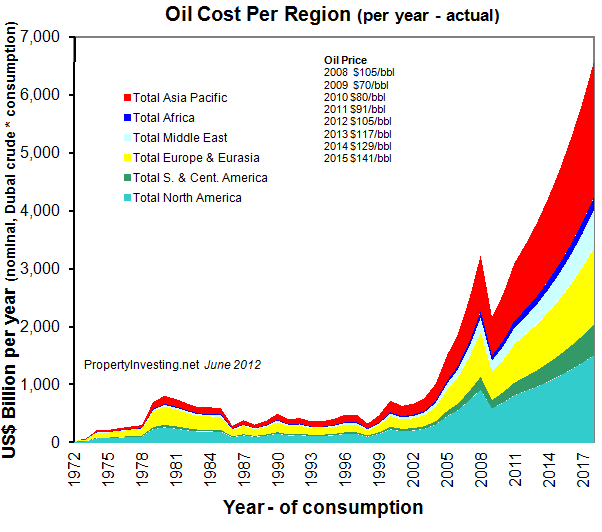
Global Oil Cost-Deficit-Surplus Per Region
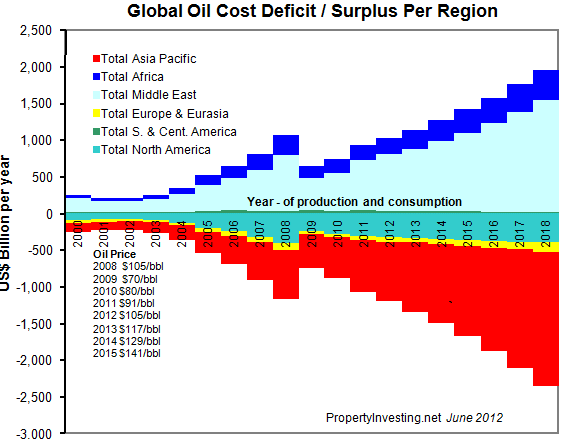
Global Oil Cost Deficit Surplus Per Region
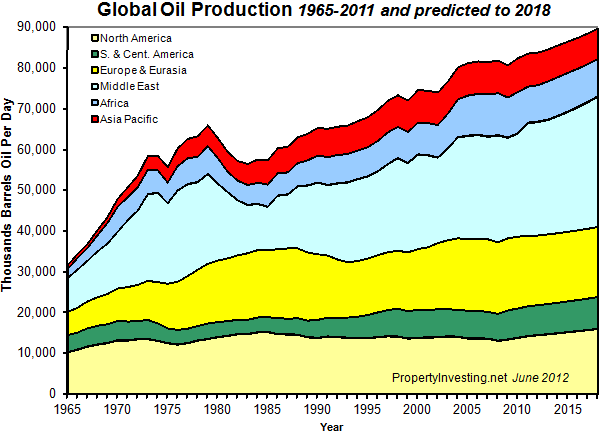
Global Oil Production 1965-2011 And Predicted To 2018
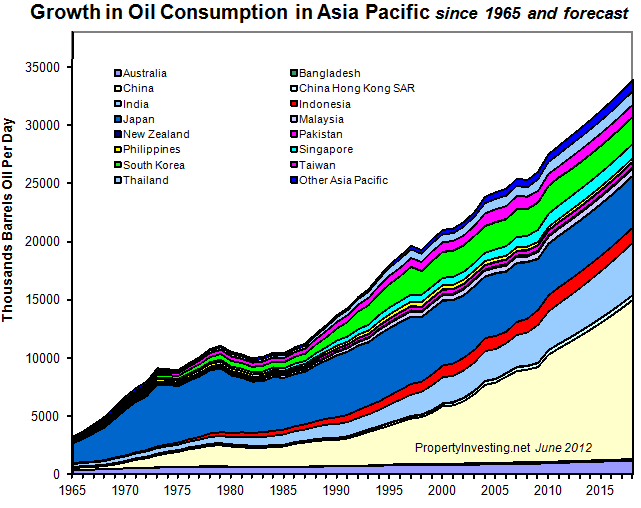
Growth Oil Consumption - Asia Pacific
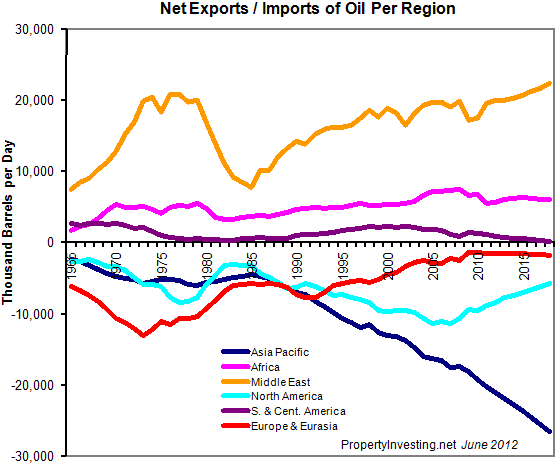
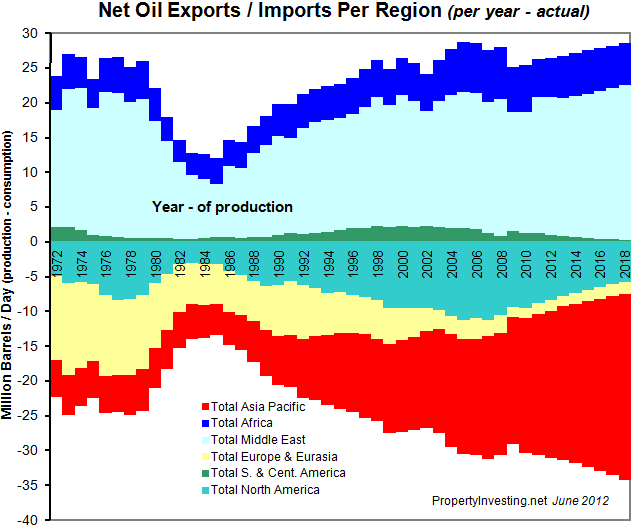
Net Exports Imports Of Oil Per Region
Net Oil Export Import Asia - Large Countries
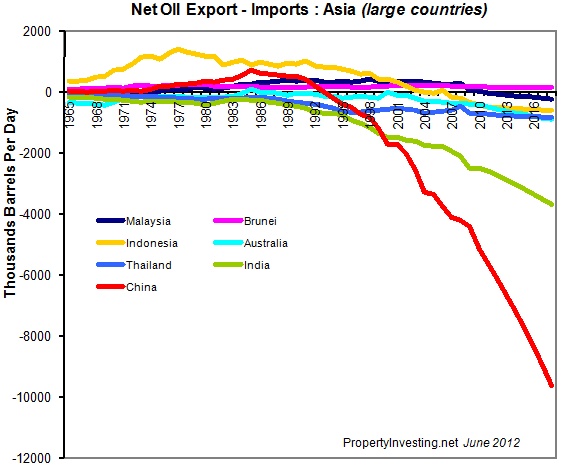
Net Oil Export Import Europe
Net Oil Export Import North America
Net Oil Exports Imports - Middle East
Net Oil Exports Imports Per Region
Oil Consumption - Middle East
Oil Consumption Production Forecast - World
Oil Cost Per Region Global
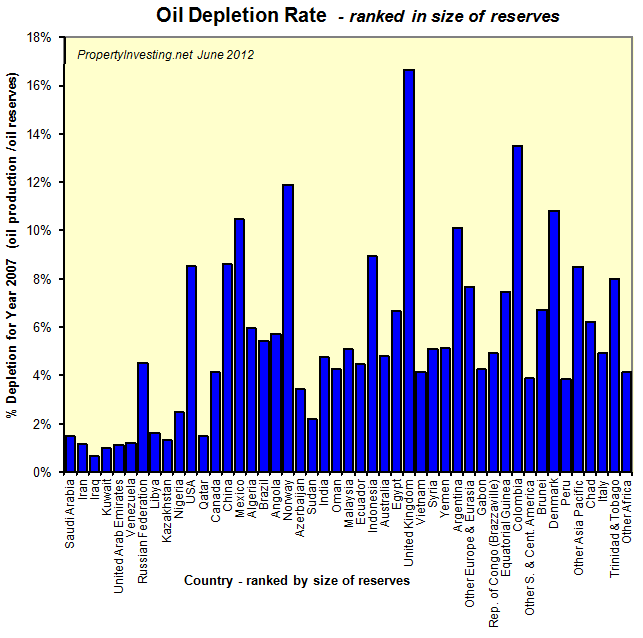
Oil Depletion Rate 2007
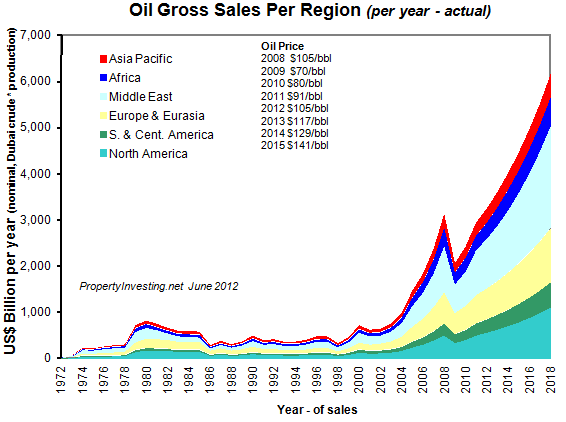
Oil Gross Sales Per Region
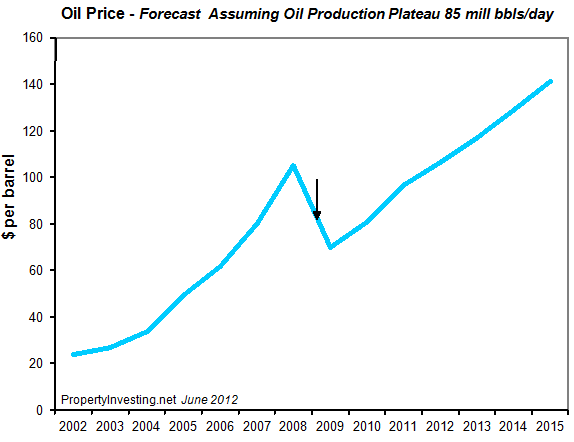
Oil Price Forecast Actual And Forecast To 2018
Key Insight: After years of economic analysis of monetary policy, we have concluded that the US GDP deficit is -10% per annum. Because of this, the Fed will need to print 10% of GDP per year - in other words inflate by 10% per year to "keep its head above water". This will in any normal year lead to an increase of 10% in the oil prices as Middle Eastern countries strive to keep purchasing power of the oil barrel produced. Hence it is a reasonable assumption that oil prices will rise 10% a year on average - - as a base case - but fluctuating wildly around this figure in relation to:
- war and security concerns and issues
- supply disruptions
- potential "unexpected" production crashes in the largest fields
- recessions - demand destruction
- energy conservation and efficiency
- environmental concerns, delays and moratorium on drilling in vast tracks of the world
- increasing production costs
- technological advances leading to reducing production costs
- demand from key areas like USA, Europe, China and India
- exploration success - or lack of it
If the supply demand picture remains constant, as we believe it will moving forward from our modelling, then economically - inflation of oil price should be 10% because of the US deficit of 10%.
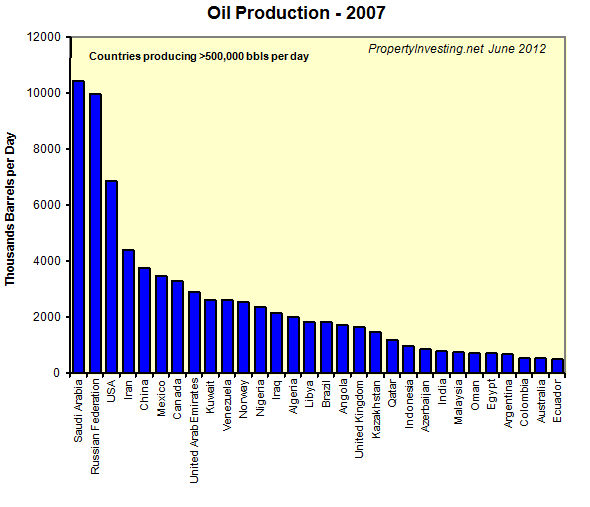
Oil Production 2007 - top countries in ranked order
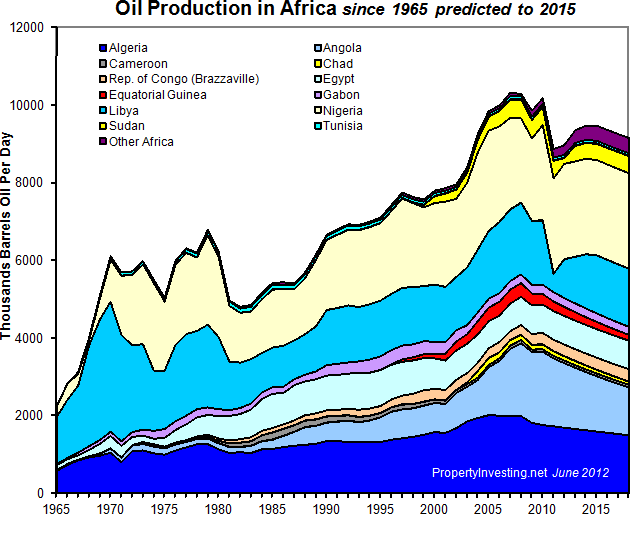
Oil Production Africa - 1995 to 2018 (forecast)
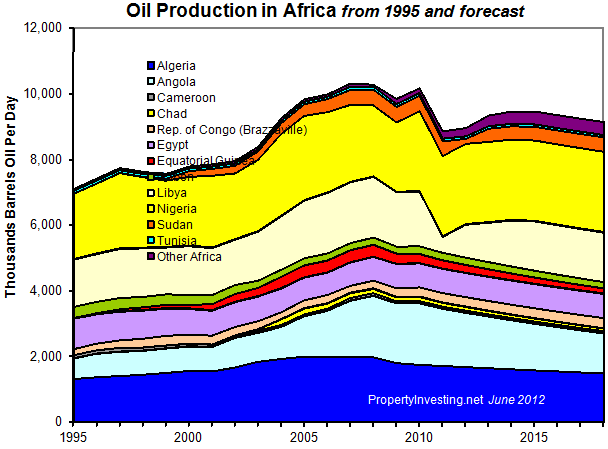
Oil Production Africa - Peak Oil was reached in 2008 - despite positive stories, oil production is now in decline
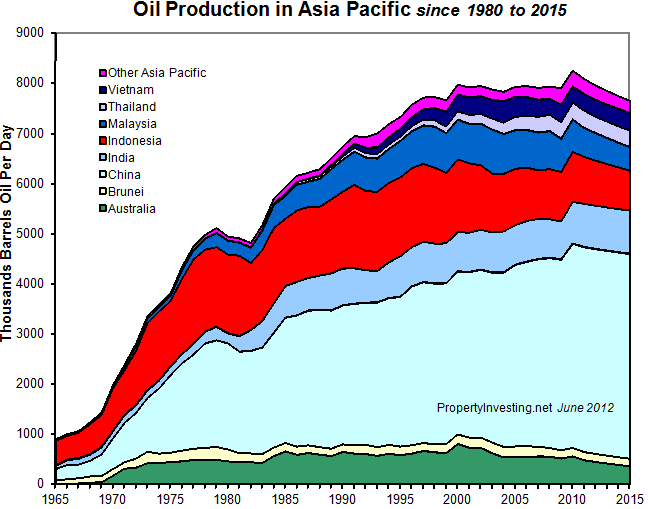
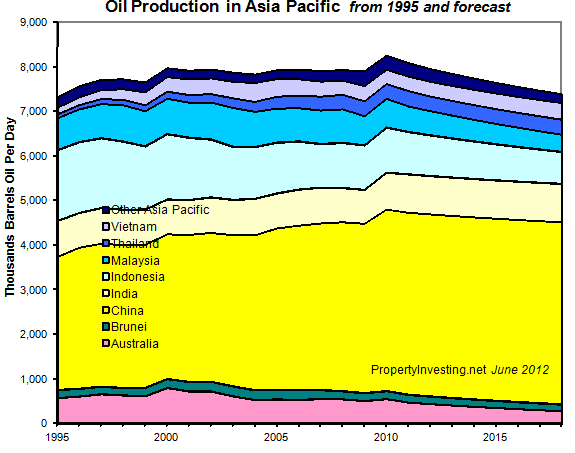
Oil Production - Asia Pacific : Oil production peaked in 2010 and should now be in decline
Oil Production - Asia Pacific - 1995 to 2018 (forecast)
Oil Production - Europe - 1965-2018 (forecast): Oil is on a plateau mainly from increases in production in "The Stans" and Russia. Norway has been in steep decline but new discoveries are likely to arrest this for a while. UK oil production meanwhile continues to crash after successive tax increased has drive investment overseas and renders large tracks of the UK sector sub-economic.
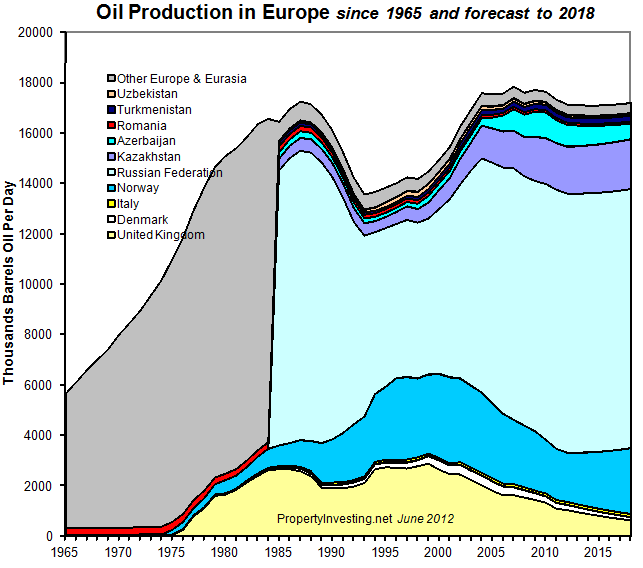
Oil-
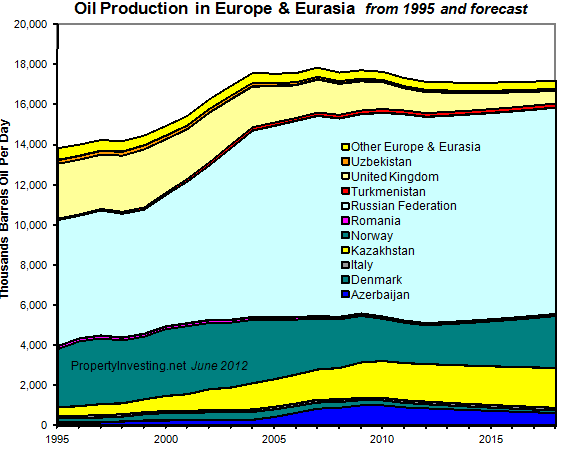
Production Europe EuroAsia - 1995 to 2018
Oil Production Global - 1965 to 2018 (forecast)
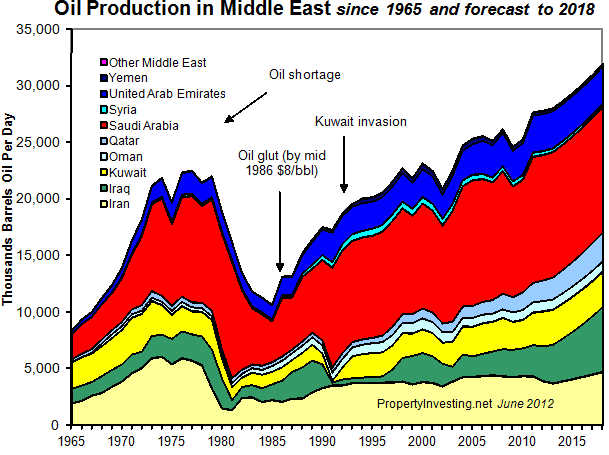
Oil Production Middle East - 1965 to 2018 (forecast)
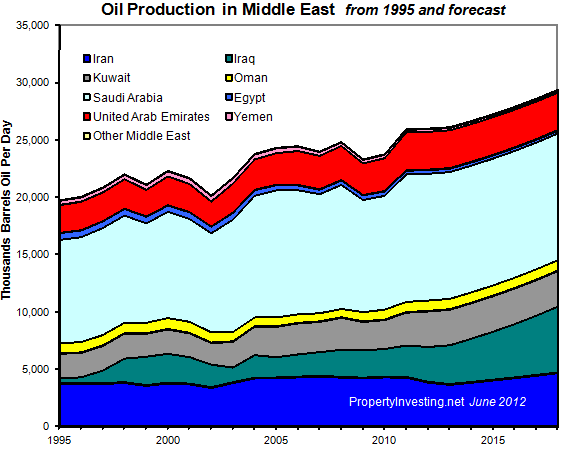
Oil Production - Middle East - 1995 to 2018 (forecast)
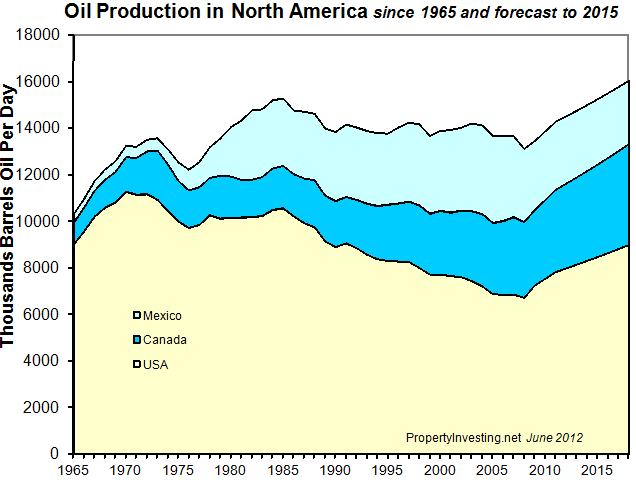
Oil Production - North America - 1995 to 2018 (forecast)
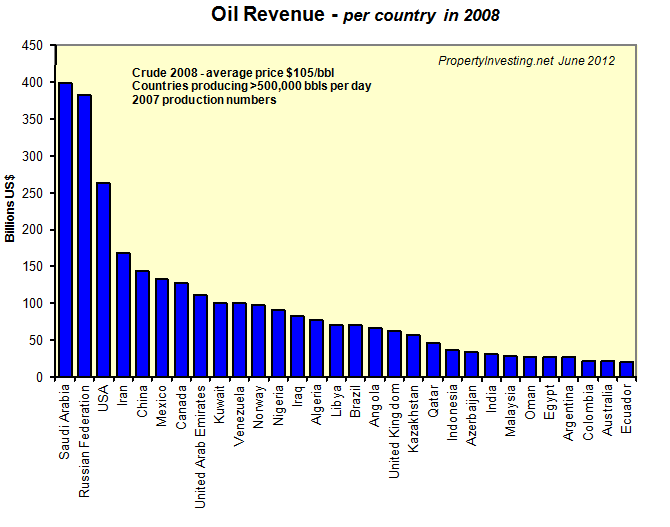
Oil Production Revenue - 2008
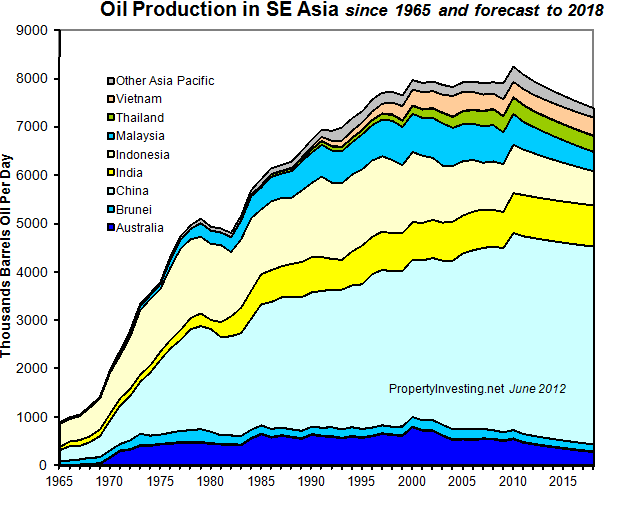
Oil Production - SE Asia - 1965 to 2018 (forecast)
Oil Production - Middle East -1995 to 2018 (forecast)

Oil Production Supply-Demand Deficit
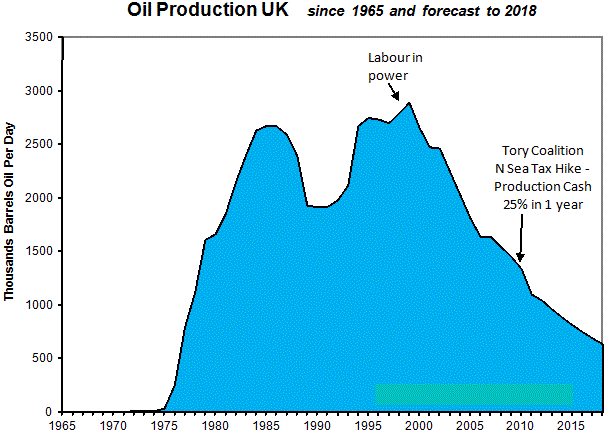
Oil Production - UK : Around 1999 Labour increased North Sea taxes - production immediately started a steep decline. Labour increased North Sea taxes again around 2003 leading to further declines. Despite oil prices rising to $125/bbl by March 2011 oil production was still incline, but then the Tory Coalition further massively increased North Sea oil taxes in a shock announcement. This precipated a gigantic -25% production crash in the following 12 months and this should continue because of lack of investment, oil companies being driven overseas and large tracts of the North Sea being rendered un-economic. After merely 12 months, the Treasury is now making less oil tax revenue in March 2012 than Feb 2012 before their rise. An unmitigating disaster for UK employment, investment, manufacturing GDP and oil revenues for the state. The UK now has the world's most unstable tax regime after 3 increases in 12 years.
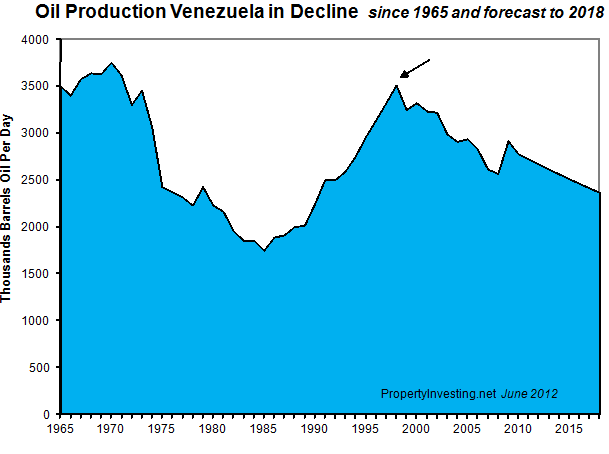
Oil Production Venezuela - Production started a crash-collapse after the oil industry was nationalised in 1999.
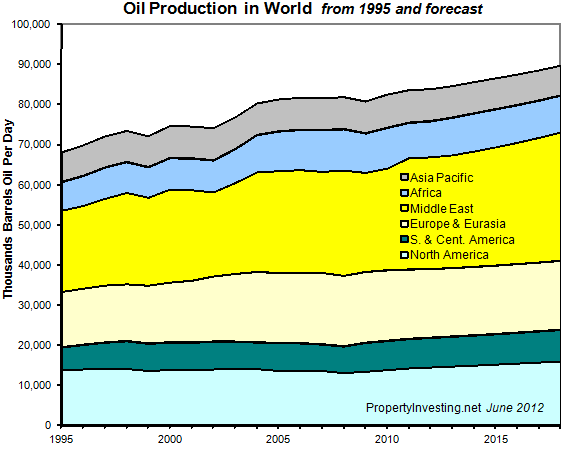
Oil Production World Per Region - 1995 to 2018 (forecast)
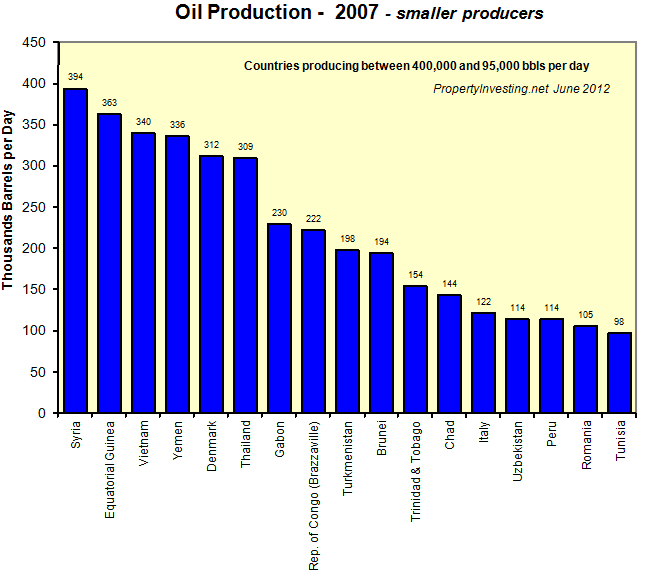
Oil Production - 2007 - Smaller Countries
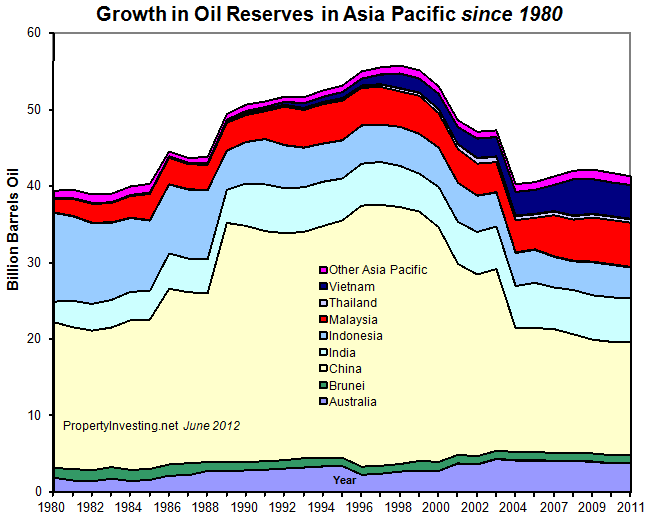
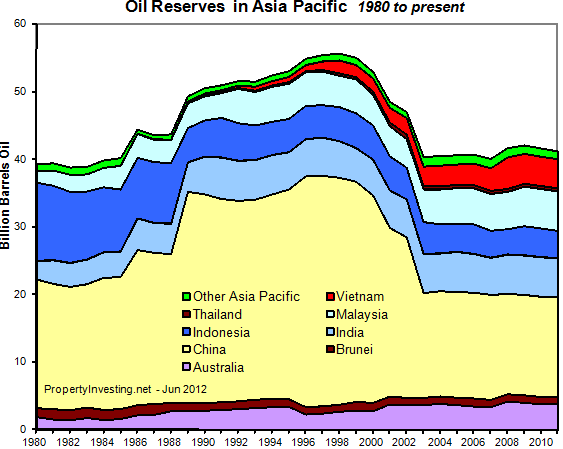
Oil Reserves Growth - Asia Pacific - 1980 to 2011
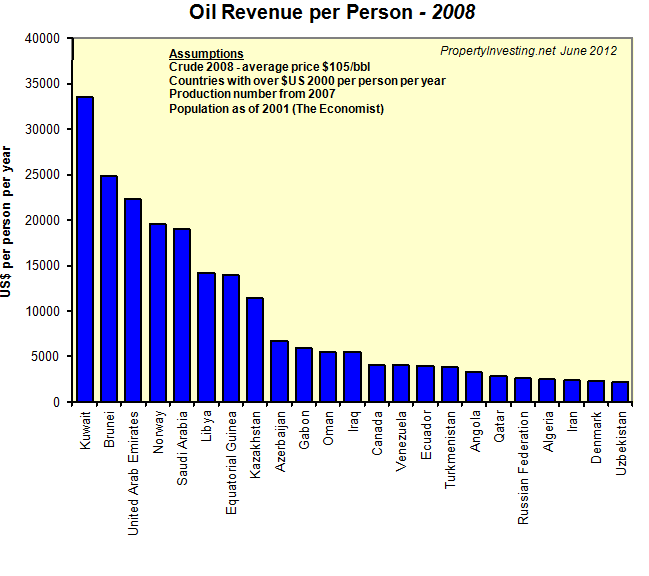
Oil Revenue - Per Person 2008
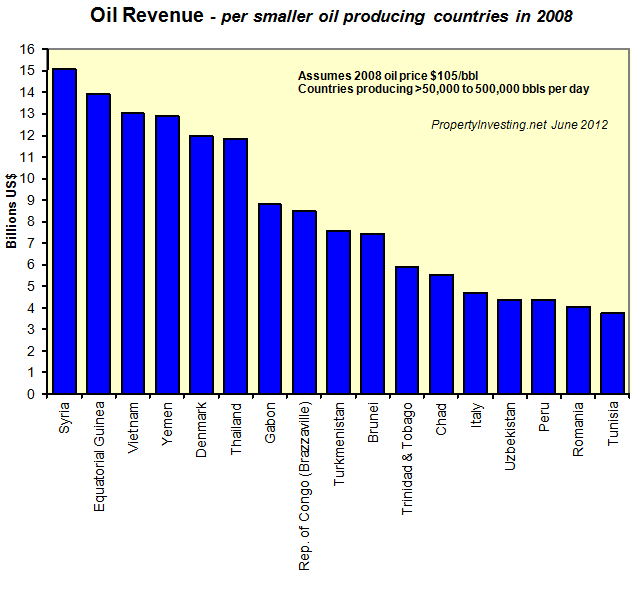
Oil Revenue - Smaller Countries
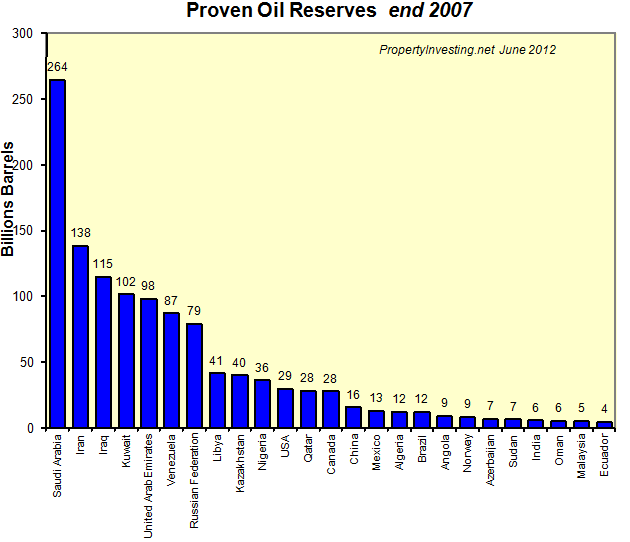
Proven Oil Reserves 2007
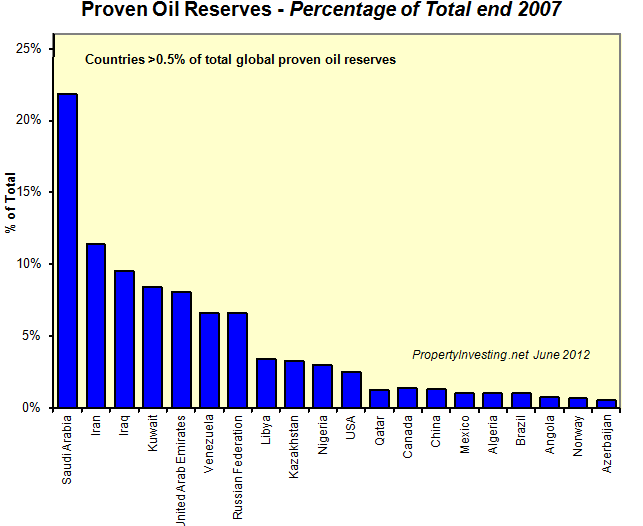
Proven Oil Reserves - end 2007
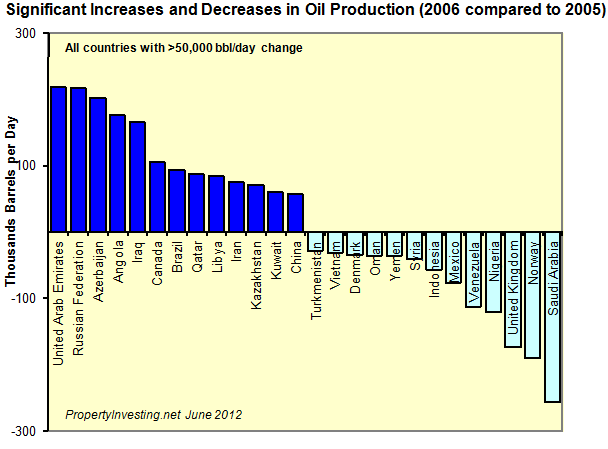
Significant Oil Production Increases / Decreases
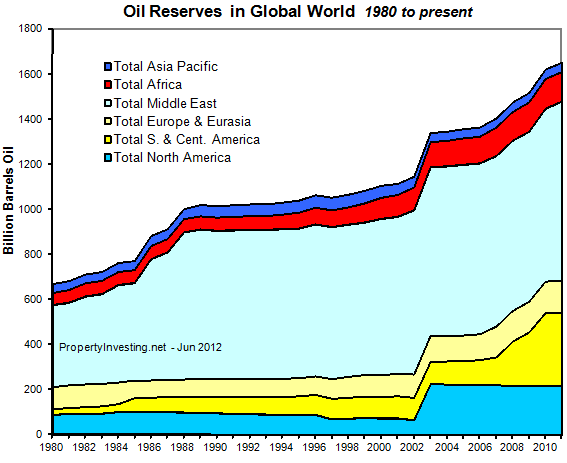
Oil-Reserves-World
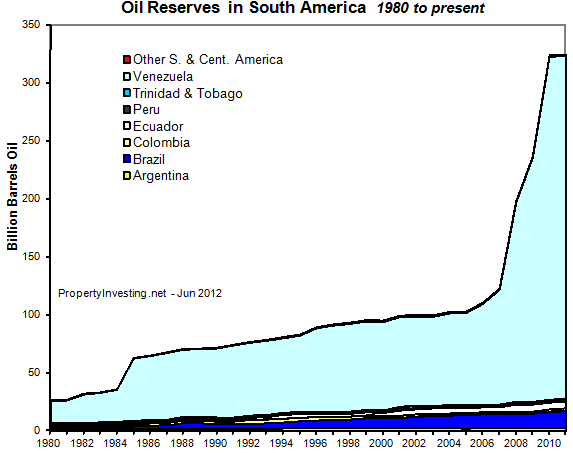
Oil-Reserves-South-America
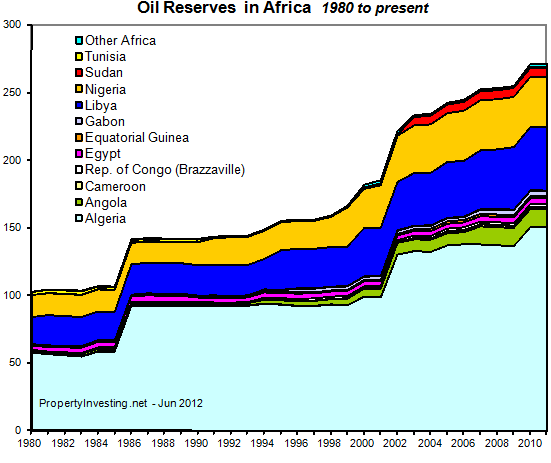
Oil-Reserves-Africa
Oil-Reserves-Asia-Pacific
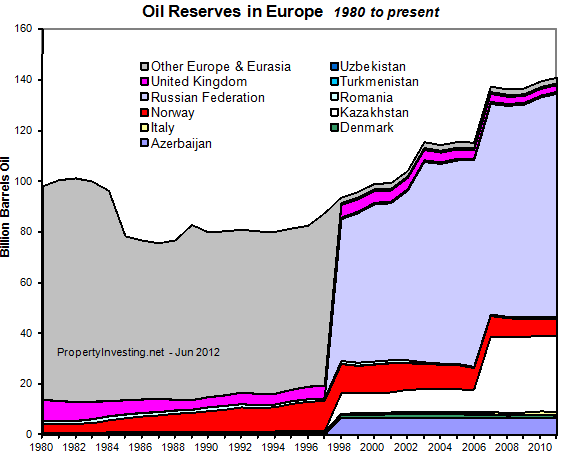
Oil-Reserves-Europe
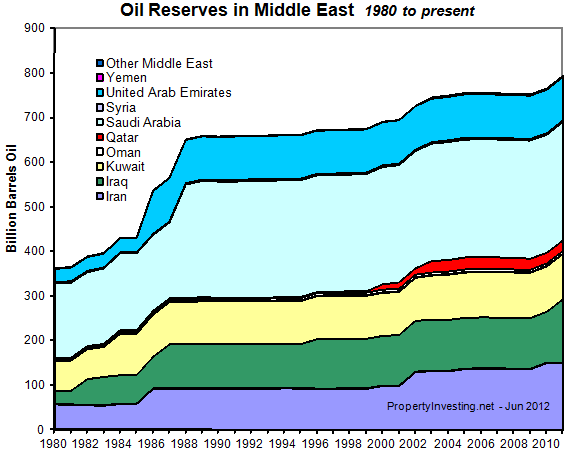
Oil-Reserves-Middle-East
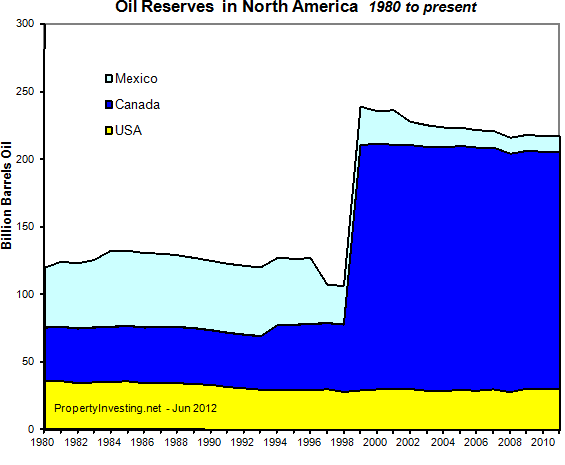
Oil-Reserves-North-America
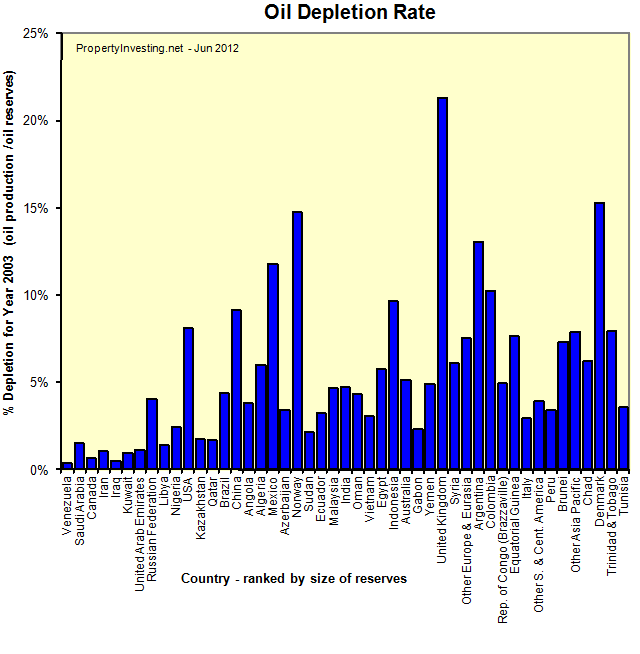
Oil-Reserves-Oil-depletion-Rate
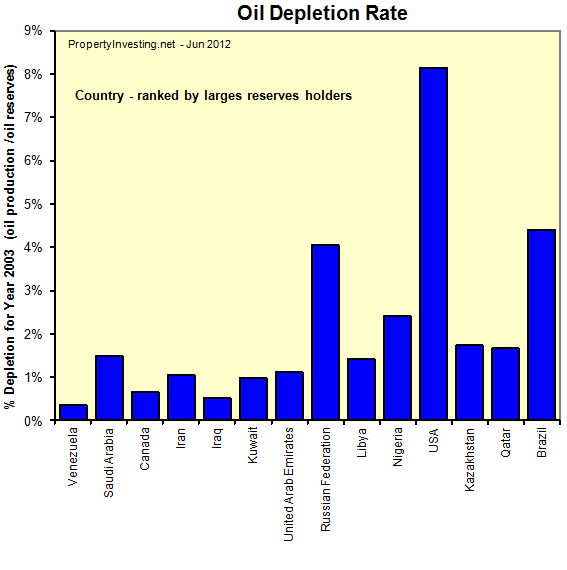
Oil-Reserves-Oil-Depletion-Rate-Largest-Reserves-Holders-2011
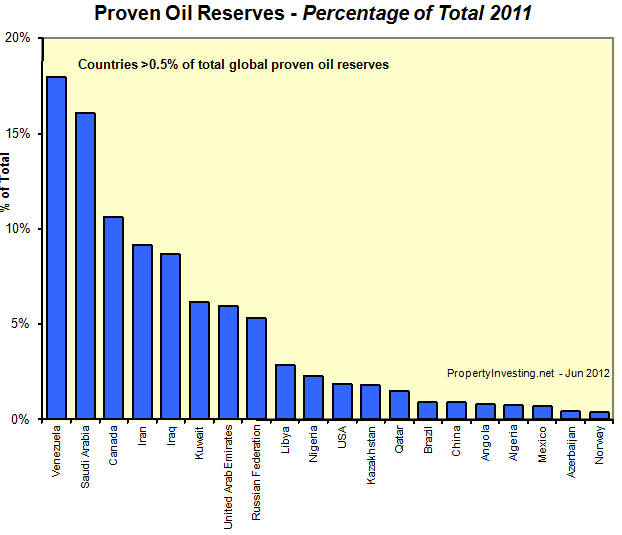
Oil-Reserves-Proven-Oil-Reserves-2011
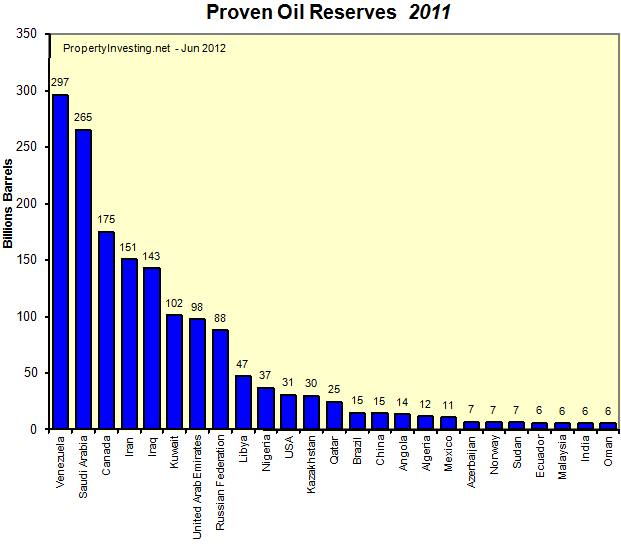
Oil-Reserves-Proven-Oil-Reserves-World
