401: Gold, Silver, Inflation and Compelling Investment Insights
11-08-2011

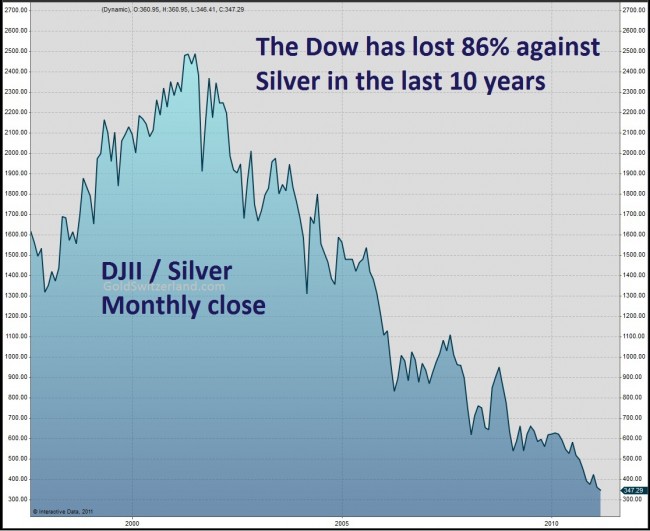
Dow Jones Collapse: The M3 money supply in the USA increased by 112% from 2000 through to 2009. However, the Dow Jones actually dropped from 14000 to 11500. If the value of the Dow Jones followed the money supply (or inflation) then the Dow should now be well over 25000. Meanwhile the M3 continues to increase dramatically by at least 18% per annum. Hence the Dow has lost 50% in inflation adjusted terms since 2000.
Debt and Unfunded Liabilities Skyrocket: The US GDP is now $14 Trillion – about the same as the official US government debt of $14.5 Trillion. However the unfunded liabilities of the USA government rose from $20 Trillion in 2000 to $50 Trillion in 2006 – a gigantic increase. These have now risen to $75 Trillion in 2011. That’s 7.5 times the GDP. The debt and obligations are increasing by $5 Trillion per annum. But the GDP between 2000 and 2006 only increased from $10 Trillion to $12 .5 Trillion. Debt levels should only increase at the pace of GDP increase - hence the US economy is now hugely indebted to the point of near bankruptcy.
Gold Massively Undervalued: Gold is hugely undervalued – just take a look at these fundamental calculations for evidence:
1. M3 Ratio: At the end of the gold bull run in Jan 1980, the currency supply or M3 was $1.8 Trillion. The M3 is now $14 Trillion, or 7.7 times larger. Gold topped out at $850/ounce in Jan 1980, so if we take this price and multiple it by 7.7, gold should be $6611/ounce at the end of this next bull run.
2. 1970s Analogue: Gold prices rose from $35/ounce in 1971 at the start of the major bull run to $850/ounce in Jan 1980 at its climax - a factor of 24.28. Gold prices were $252/ounce at the low point in 2000 at the start of the bull run – hence if we multiple this by 24.28, we have gold at $6118/ounce at the end of the bull run.
3. CPI Linkage: In Jan 1980 gold was $850/ounce. According to the famous gold investor John Williams, who has reconstructed the original CPI inflation index going back to the 1970s, the peak of $850/ounce in 1980 should now be equivalent to $6484 as of April 2008 – and higher today.
4. Dow Jones Ratio: The Dow Jones industrial average normally is equal to the price of gold at the end of each gold bull run. Hence one can postulate that if the gold price was about $6300/ounce, then the Dow Jones index should also be 6300 – after halving. This would imply a more reasonable P/E ratio at the end of a stock bear market of 11 rather than the current 22.
Gold Price Prediction: So considering all three or four methodologies going back to mid 2008 only, gold would top out at ~$6200/ounce at the end of the bull run once inflation gets out of control and panic sets in.
Upside to Gold: Just in case this logical analysis is not convincing enough for you – then consider this. If you add up all the currency in the world then divide it by the total amount of gold, you get $66,000/ounce. Yes, some people actually believe this is the true value of gold – it would be if the whole world reverted to a gold standard. Some say fiat currencies are a temporary thing – currency has been discredited and we will be reverting to gold and silver as standards in the next five year. Hence  the logical upside is $66,000/ounce, with a base case of $6,200/ounce once inflation starts in earnest.
Silver Stocks Dangerously Low: In 1980 when the silver price reached a high of $50/ounce, silver stockpiles were 2.5 Billion ounces. In 1990 these dropped to about 2.1 Billion ounces. Today stockpiles are practically zero. Silver is rarer now than gold. The US stockpiles of silver are now down to 20 million ounces. In 1980 they were 3.5 Billion ounces. Hence stockpiles are only 0.056% of what they were in 1980.
Gold To Copper Ratio: Gold in 2005 dropped to an all time low against copper and in 2006 gold dropped to an all time low against wheat.
Deficit = Printing Money: The US annual income is $2.2 Trillion and its expenses are $3.8 Trillion. The deficit is therefore $1.4 Trillion, which in turn is about 10% of GDP. This is as bad as Greece’s % of GDP deficit. The only way to pay this debt is to print more money. This is one key reason why gold and silver prices will sky-rocket in dollar terms. Gold and silver are money and a store of wealth. The US dollar will destroy wealth as a fiat currency that is devalued by more printing of money, inflation and low growth – stagflation – just like in the 1970s.
Silver Stocks Almost Gone: If you add all the USA stocks of silver compared to what the USA used to own back in the 1970s, it adds up to a mere 0.016% of the previous quantity. In 1979 when silver reached $50/ounce there was 2.5 Billion ounces of silver at surface – now all stocks have almost vanished.
Silver and China: Most silver is used for manufacturing. China uses 70 time less silver per person than the average western person. As China industrialises - that's 1.4 billion people - and more people get more flat screen TVs, mobile phones, PC, eletronics etc, silver demand will rise sharply. Meanwhile stocks are at a historic low. In the next ten years, there is almost certain to be a severe supply-demand tightening.
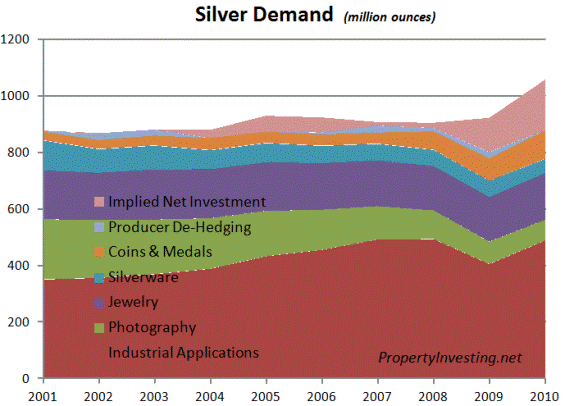
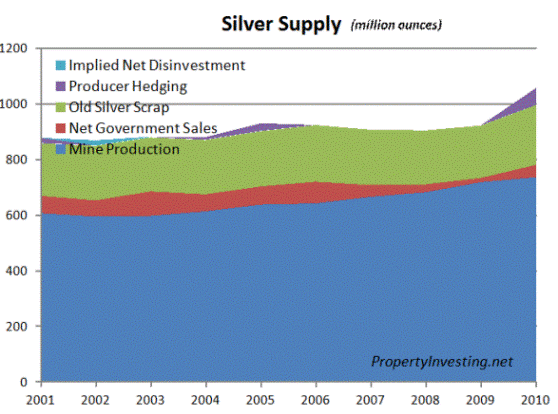
Silver Is Bi-product: It’s also worth considering that 75% of silver is a bi-product of copper, zinc, lead and gold. Hence it is reliant on high prices in these metals or large volumes of these metals being produced. Hence a mining issue in any of these sectors hits the supply of silver, and even if silver rises dramatically in price, it will not make silver mining economic in most instances. There are only 500 million ounces of silver mined each year and the primary silver only mines acc ount for only 25% of this quantity – 125 million ounces. That’s only $4.4 Billion worth of silver at $35/ounce. This is a minute amount. Any investment bank could buy the lot quite easily at $35/ounce.
Silver Inventory: In 1990 there was about 15 years of silver inventory. Now there is practically no inventory. Some project that silver supplies in mines will be exhausted completely in 5-7 years time.
Silver Uses: Silver has 100s of industrial uses. 90% of gold that has been mined is still on the surface. All the gold in the world is 40% more than the amount of silver, yet silver is 42 times lower cost and is needed for electronics and business.
Silver Inventory Recovery Time: It would take 15 years to get silver inventories back to the levels of 1990 – but environmental constraints, skills shortages and capital constraints mean this will never happen.
Silver to Property Ratio: In 1971 in the USA at the start of the silver bull run, an average property cost $20,600. And silver was trading at $1.39. That meant a house cost 14,000 ounces of silver. B ut by 1980, a house cost $42,700 though silver was $52/ounce meaning one could buy a house for 814 ounces of silver. That meant silver outpaced inflation by 15 times. Silver also delivered 17 times higher returns than property during this 9 year period.
17˝ Year Bull Run – 60% through: Fast forward to the present time. The current bull market started in 2000, but did not really start ticking up until about 2005. We believe the bull market will end sometime between 2013 and 2018 – it could even be outside this range. But we have some considerable way to go.
Euro Debt and the End of the US Safe Haven: As expected, the Euro contagion has just started to severely impacting Italy, a country that is too large to be bail-out by Germany. Rates have sky-rocketted above 7% - generally considered the point when a county can no-longer sustainably service their debt. It's going to be a very interesting and turbulent few months. There has been a flight to the so called "safe haven" of the US dollar - as the focus of international markets has been on Italy and Greece. But we believe there will become a tipping point when US counties and states start to declare bankruptcy - this will then highlight the gigantic debt problems USA has. There will then be more printed money - and international markets will then take flight from the US dollar and bonds with low rate of 2%. Instead of being ha ppy with 2% interest rates, these rates will need to sky-rocket - to say 5-8% to keep investors happy. At this time, the USA will no longer be able to afford it's interest rate payments, just like Greece on a micro-scale and Italy on a medium scale. The world will then have run out of currency safe havens to run to - and there will only be one option left - you guessed it - buying gold and silver "money". One could describe the Euro problems as a smoke-screen for the elephant in the room, the US debt problem. And we are fairly convinced that within a year or so - markets will turn against US bonds and the USA will be at the end of its economic empire status. We are hoping this will not happen, but realistically it will. It could be accelerated by OPEC pricing oil in a basket of currencies, and energy contracts being traded in Chinese, European or a basket of currencies, or the Chinese accelerating purchases of gold before un-pegging from the US dollar. As the US economy stalls and becomes less significant in global terms in the next few years - Russia, the Middle East, India, China, Europe and the Far East block will look to detach from the increasingly diluted value of the dollar and the USA will be forced to print even more money as debt problems escalate, inflation takes off and US living standards decline.
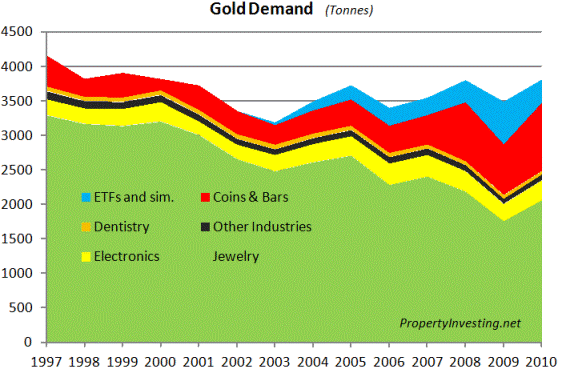
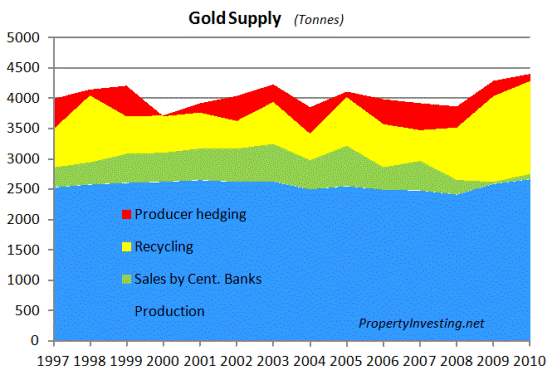
Gold Then Silver: Research has shown if there is severe deflation or inflation - and general market panic - then gold prices rise sharply. It is the ultimate safe have. Before inflation, there is normally a deflationary scare that drives gold prices higher and silver prices lower. Then as governments panic and start printing money to attempt to inflate their way out of trouble, the resulting severe or hyperinflation and economic stagnation then leads to  further gold price rises shortly followed by meteoric silver price rises towards the end of the gold and silver bull runs. Hence on market timing, gold is normally the best bet early on as the gold : silver price ratios rise to range 40-70. This is partly because the deflationary scare makes the market think manufacturing - using silver - will drop in the doldrums. But as money printing accelerates, then gold prices rise followed by silver rising far faster playing catch-up, resulting in the gold : silver ratio dropping from 40-70 to say 15-30. We are still in a "deflationary scare period" at present and gold would seem the safest initial investment, but by mid 2012 we should be well into an obvious inflationary period when silver prices start rapidly shifting higher. So expect gold to start moving higher now with silver very much higher into 2012 in the run up to the US elections. If you firmly believe we will only ever see deflation, then gold is the one to invest in. We believe there is a temporary delfationary scare that will be followed by severe inflation starting around mid 2012 - hence we are buying mainly gold now, and plan to switch part of the precious metals portfolio to silver around March 2012.
US Will Default: The US will either default on its debt obligations - default on its debt - or default on its currency - e.g. print so much money that it will inflate the dollar some much it becomes almost worthless and hence default by stealth through printing money. One could argue the most likely is the latter and this has already started about 3 years ago with QE1. If the US doubles money supply, gold prices as a bear minimum should double. The Fed knows nothing else than adding digits to electronic dollar numbers - issuing IOU notes based on no reserves or asset - and winging it. Hence gold will rise dramatically because of this policy. They only know one thing - and that is - when financial problems surface - to press the panic button and print more money.
USA and War: Without wanting to come over as very gloomy, ultimately, by the end of this  decade, as happens at the end of all inflationary periods, there are likely to be more wars - over resources. Whether this involves Iran, China, USA, Europe or African nations no-one knows, but essentially economic hardship, food shortages and inflation normally lead to wars. The real concern for people looking at the USA and having lived there is that most people have guns - so it's not hard to envisage a lot of angry people starting to use these weapons - a key reason why we'd rather be in Europe during these hard times. One only needs to look at what's happening in northern Mexico on the border of the USA to realise that too many guns and economic hardship lead to a lawless society with armours vehicles on the streets.
Safe Havens: The ultimate and only real safe havens shortly will be Norway, Switzerland, Canada and Australia. All countries with huge natural resources to underpin their currencies. All co untries with high ethical standards, solid laws and stable economic policies. All countries with minimal debt and no printing of money - with large gold reserves and good border security. London could be added to the list with regards to property and a place to live because Britain is an island and many wealthy international people find refuge in good value UK Sterling property in West-Central London.
Inflation All The Way: Hence we would expect house prices to double between say 2000 and 2017 but will be lower in inflation adjusted terms by 2017. However, we believe silver prices will probably go ballistic over this period and $35/ounce is an incredible low point in the overall ~17 year bull run. Don’t be surprised if silver peaks at $200, $400 or $600/ounce once the herd get in.
