205: World country opportunity and risk assessment for property investors - unique ranked listing
07-13-2008
PropertyInvesting.net team
In this Special Report we have ranked each country based on the oil export (surplus) or import (deficit) as a proportion of the country’s GDP, then additionally taken into consideration key macro-economic country criteria to prepare a qualitative listing of countries - to guide country investment decisions, and to high key risk countries for property investment.
 The trigger for this analysis has been the commodities boom that has taken hold in the last five years, caused in part by the boom in demand from
It's obviously very hard to predict overall future outcomes, and our Special Report 199 highlights this in describing contagion affects and lack of predictability of outcomes. That said, what we have attempted to perform is a form of risk assessment, coupled with colour coding key economic criteria to highlight a countries key strengths.
The criteria are colour coded to make it easier for you to absorb the analysis. The chart is relevant as long as oil, gas and coal/power prices remain relatively high -and as our regular visitors are aware, we believe they will remain high and this chart therefore becomes more relevant in future years to manage investment risks.
In summary, with such high commodities prices, an ideal country would have:
- Oil: Huge oil production and exports (coloured column 1)
- Gas: Huge gas production and exports (coloured column 2)
- Coal-Power: Huge coal-power-nuclear-hydro production and exports (coloured column 3)
- Manufacturing: Highly efficient and low cost manucturing using latest technology or human capital (coloured column 4)
- Financial services: Highly efficient, innovative, high technology financial and business services using knowledgable-highly educated workforce (coloured column 5)
- Security: High internal country and regional security with little secruity threat (coloured column 6)
- Demographics: Expanding population - non aging workforce, though not too many young people within social fabric of country (coloured column 7)
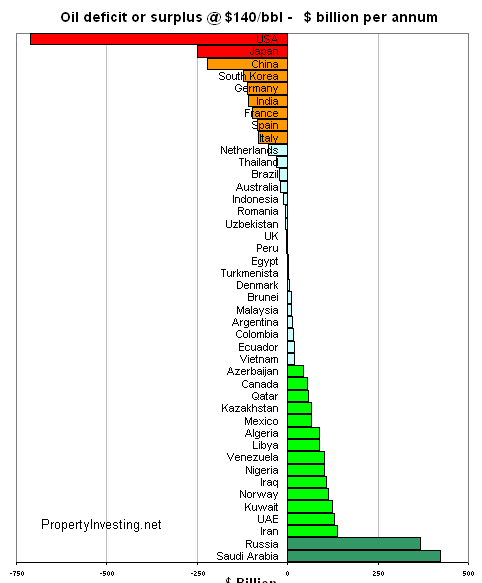
Because of the 1400% increase in oil prices from 1999 ($10/bbl) to 2008 ($140/bbl) we have highlighted the overall surplus or deficit of oil as a percentage of overall country GDP (2007, World Bank numbers). The reason for highlighting oil is that this is a KEY CHANGE in the global economic landscape in the last 5  years that will start to dictate future outcomes of wealth distribution, and hence property price / asset increases in respective countries. Where this is economic change – positive or negative, there will normally be property asset price changes. If incomes rise, property prices rise.
Overall cost of oil imports in the world at $140/bbl is $2 Trillion per annum ($0.71 Trillion is to the
We have then given an overall rating. Ideally, look for dark green or light green - those are the countries with everything working positively for them with high oil/gas/coal prices. And one would tend to avoid countries with too much red. A country with massive % GDP oil deficit, no oil/gas/coal/power, high cost low efficiency manufacturing, poor financial services and an aging population with security threats would rank the lowest (Italy and Greece spring to mind). It would not be wise to execute property investing in such a country.
Oil Surplus Deficit @ $140/bbl as a percentage of GDP
Country
2008 Surplus/ Deficit $bln
2007 GDP $bln
% GDP
Oil
Gas
Coal or Hydro-other
Maufact-uring
Financial Services
Security
Demo-graphics
Overall rating
Libya
89
69
129%
Iraq
107
100
107%
Kuwait
123
116
106%
Qatar
58
56
104%
UAE
130
132
99%
Saudi Arabia
424
554
76%
Azerbaijan
43
65
66%
Brunei
10
19
51%
Algeria
88
188
47%
Norway
113
253
45%
Kazakhstan
65
168
39%
Nigeria
102
293
35%
Venezuela
100
334
30%
Ecuador
18
99
18%
Iran
139
777
18%
Russia
368
2088
18%
Vietnam
19
221
8.5%
Turkmenistan
3
34
7.7%
Colombia
17
321
5.2%
Mexico
66
1346
4.9%
Canada
55
1178
4.7%
Malaysia
11
355
3.2%
Denmark
5
198
2.8%
Argentina
12
523
2.4%
Egypt
1
404
0.4%
UK
-4
2082
-0.2%
Peru
-2
219
-1.0%
Brazil
-23
1834
-1.3%
Indonesia
-12
841
-1.4%
Australia
-20
733
-2.7%
Romania
-7
246
-2.8%
China
-223
7348
-3.0%
India
-109
3092
-3.5%
Germany
-111
2752
-4.0%
Italy
-80
1780
-4.5%
France
-96
2054
-4.7%
USA
-712
13811
-5.2%
Japan
-249
4284
-5.8%
Thailand
-31
519
-6.0%
Spain
-83
1373
-6.1%
Netherlands
-53
625
-8.5%
South Korea
-123
1199
-10%
Uzbekistan
-6
45
-14%
Legend
Very high rating
World class
High rating
Good
Medium rating
Moderate
Low-medium rating
Poor
Low rating
Insufficient-none
To highlight a few countries you might be interested in:
 Nuclear power still account for ca. 20% of power requirements. Renewable energy is increasing from a very low base. A lot of the global oil, gas and mining wealth also comes back to
Overall, despite the weakening economy and high taxes, the
USA: The oil deficit situation for the USA looks bleak - at present the country is spending $712 billion on importing oil per annum, compared to it's GDP(2007) of $13,811 billion - a massive 5.2% of it's overall GDP. This is like slapping an additional tax rate of 5.2% on the economy as a whole (all goods and services). This will act as a drag on the economy down over years to come - and the  of it. Standards of living will likely would drop somewhat to compensate for high oil import costs. Currency re-adjustment might help the deficit, but oil imports will have a very negative long term impact. The faster transportation innovation develops the better - what we're talking about here energy conservation and efficiency savings, more renewables projects (possibly wind, solar), electric cars, natural gas powered car and (clean) coal-electric plant expansion. But the good news for the

We hope you have found this compilation insightful and it helps balance your investment decisions. In summary, expect the green to have rising asset prices and the red to have subdued or lowering asset prices – as the massive transfer of commodities wealth begins in earnest.
If you would like us to prepare a write up on any other country of your interest, please request this via email to enquiries@propertyinvesting.net and we can add to this report.

