198: Global Oil Insights for Property Investment 2008 - key findings
06-14-2008
PropertyInvesting.net Team
Oil Crisis and Property Investing: What now follows will shock you. It will reconfirm why you choose to visit this website to get the latest insights into property investing, wealth creation and the oil crisis. And it's just the beginning. Our unique oil analysis from recently released historical oil data modelled using our own oil production and consumption predictions looking forwards confirms again what we modelled in June 15th 2007 - that there is a supply-demand imbalance that will continue to escalate oil prices. Supply cannot and will not keep up with demand assuming oil prices stay at $125/bbl - we believe to close the gap, oil prices have to rise far further. How high they ultimately rise will depend on the elasticity of oil demand. Evidence suggests demand is not being affected by higher oil prices as much as analysts thought likely a year ago. Only a global recession - something highly unlikely - will reduce demand. Meanwhile, supply is only rising very slowly - and this might not be sustainable.
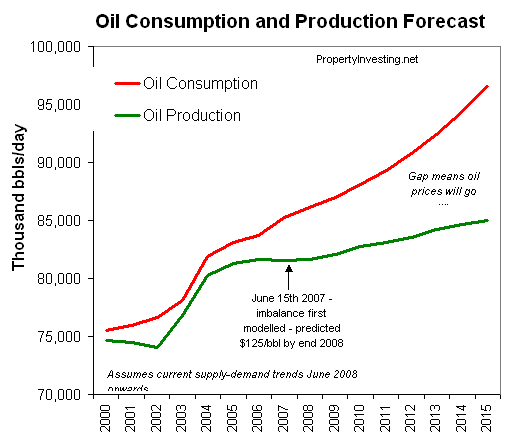
Global Oil Consumption and Production: According to our detailed mathematical model for supply (production) and demand (consumption) built for every country in the world - demand is forecast to rise far higher than supply. We expect supply to drift upwards to 85 million bbls/day (from the current 82.5 million bbls/day) by 2015 - BUT this is NOT fast enough. Demand should increase by 1.3 million bbls/day per year - whilst supply by only 0.4 million bbls/day - the only way to reduce this gap is for oil prices to increase to curb demand. It's simple supply-demand economics. Because oil demand is so inelastic e.g. it does not respond well to higher prices, we see oil prices skyrocketting. Sorry, it's the painful truth. We've been warning of this situation since June 15th 2007. Hence our base prediction is for oil prices conservatively to rise to $316/bbl by 2015 - with a 20% increase per annum "at least" for the next few years. This should help curtail demand down to forecast supply levels - there is a chance it still does not and prices skyrocket and spike higher a lot earlier - a possible panic and a spike well over $200/bbl either this year or in 2009. We believe fundamentally that oil prices need to move higher and there is a firm base for our projections - otherwise demand growth will not decrease with China and other developing countries demand growth.
Unique Economic Model and Forecasts: The below assumptions for regional and country wealth generation from oil revenues alone are massive - and these is are based on a conservative 20% rise per annum in oil prices over and above $125/bbl in 2008 (remember oil prices have doubled in the last year, since we made our prediction June 15th 2007 of $125/bbl by end 2008).
Beware of Weak Economies: The bottom line for property investors is - don't be caught out by investing in property in weak economies that do not benefit from oil wealth (e.g. large net oil importers per capita with weak developed economies - examples are Italy, Greece). Instead, aim for strong stable economies with large per capita oil exports such as Norway and Canada - property prices will rise and local currencies will also strengthen as oil prices rise. Or countries with very competitive manufacturing industries - e.g. China, and possibly South Korea.
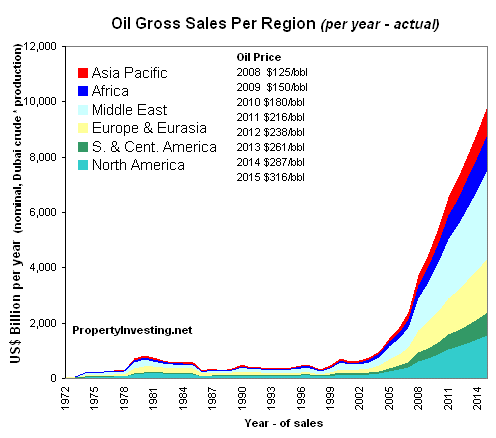
Gross Sales Revenues of Oil "Produced" in Each Region: There will be a massive transfer of wealth from oil importing nations to oil exporting nations as oil prices remain high and get higher still. We believe the total value of oil revenues by 2015 will be a staggering $10 Trillion per year. This wealth will be heading to the larger oil producing nations. Sovereign Wealth Funds will be flush with cash - some of this cash will be used for indigenous business, infra-structure and property investments. But another part will be re-invested where the money originally came from - in the oil importing nations, as asset prices for business and property remain suppressed. Business is like a washing machine - money goes around - and we expect these funds to end up as sovereign weath equity ownership in western assets - for example businesses and property in USA and western Europe.
Regional Net Value of Oil "Consumed": The total value of the oil consumption in each region or "oil cost" - is presented below. The cost of oil will rise from $0.5 Trillion in 2002, to staggering $12 Trillion in 2015. North America and Asia Pacific will see huge rises in this cost of oil - for North America, consumption declines slightly whilst in Asia Pacific, oil consumption rises - further accentuating the rise in cost. These costs have to be paid for by earnings-productivity in manufacturing and business. Ultimately, they will raise the price of consumer goods and put pressure on inflation and interest rates in the process. Meanwhile, the big picture is that the oil will be paid for by assets in the oil importing nations. Infra-structure, businesses, equity and property will be sold to oil exporting nations - to pay for the oil. This may sound radical, but it's the economic of a global business. Someone has to pay, using something.
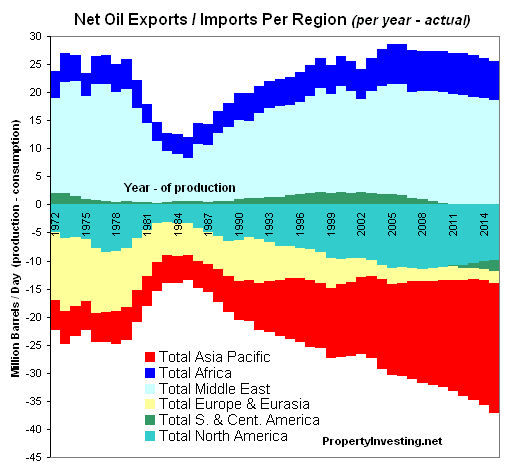
Regional Net Oil Imports (Deficits) or Net Oil Exports (Surpluses): Net Exports and Imports per region from 1972 to 2008 and the forecast up to 2015 is presented below, as a stacked time-bar chart. As one can see, Asia Pacific's imports rise dramatically. Europe's drop, though this masks Russia's dominance in oil production at ca. 9 million barrels per day. Overall oil consumption in Europe will drop as efficiency is improved and regional concerns on climate change stimulate a switch to renewable energy, nuclear power and more efficient cars and transportation - possibly electric cars. The only regions with increasing oil exports will be Africa (mainly driven by Angola and to a lesser extent Libya) and the Middle East, as one would expect.
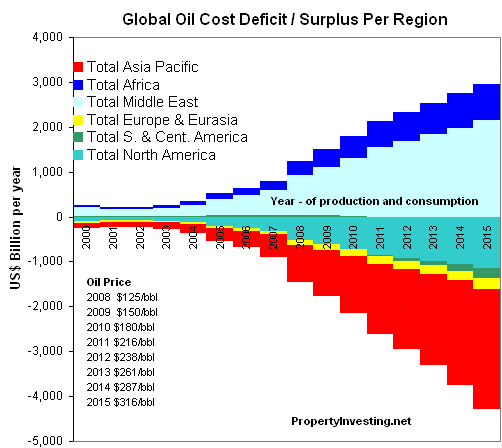
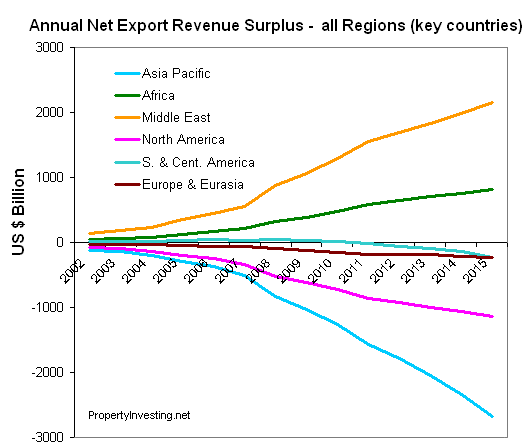
Regional Net Oil Expenditure (Deficit) or Net Oil Sales (Surplus): The regional net oil cost (oil production minus consumption) is modelled below using historic data from 2000 to end 2007, and our forecast from early 2008 to 2015 - using the oil prices presented above (20% increase a year to 2012). Africa ($0.8 Trillion by 2015) and Middle East ($2.4 Trillion by 2015) are the only two regions with oil cash surpluses - all other regions have a net deficit. For property investors, expect property prices to rise in the Middle East and oil exporting nations in Africa. But propert prices will be suppressed in many other regions as high oil prices take their toll. Notable exceptions to this rule - will be countries with high projected oil exports are: Venezuela, Canada, Russia, Norway and Brunei.
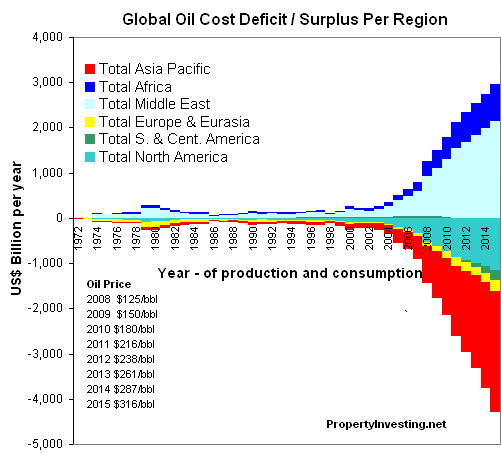
Regional Net Oil Expenditure (Deficit) or Net Oil Sales (Surplus): The below chart is the same as the chart above, except it runs from year 1972 (instead of 2000). What is illustrates in the long period with low oil costs - compared to the massive increase oil costs from 2004 onwards as oil prices rose from $35/bbl to today's $130/bbl - and continue to increase to $316/bbl by 2015 according to our forecasts. Whilst low wages and a strongly developing manufacturing base in China and India will prevent marked negative economic impacts in these two countries, developed western European and USA plus most of Africa will feel the biggest negative impact from these high oil prices. They will likely unfortunately lead to fuel and food shortages in most of western, central and southern Africa. Low oil prices helped poor countries in the period 1986 to 2004, but now there is a very unpleasant strong head-wind for all African, plus south and central American countries that do not produce any oil, gas, coal or minerals. These countries will be particularly exposed to food crisis and water shortage/drought.
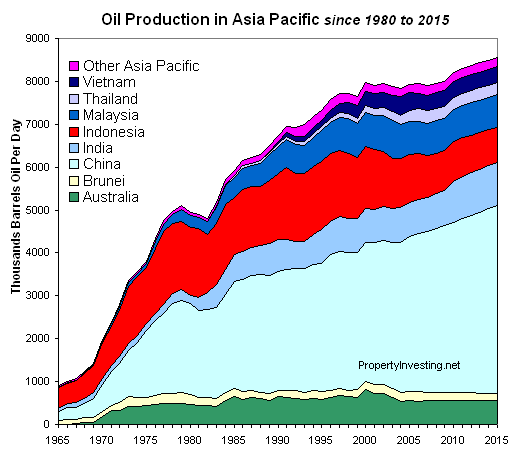
Oil Production of Asia Pacific oil producing nations - history and forecast: The chart below shows the increase in oil production in Asia Pacific from 1980 to end 2007, with forecast from 2008 to 2015. However, by 2015, the region's oil consumption will be double the production - leading to large oil import costs.
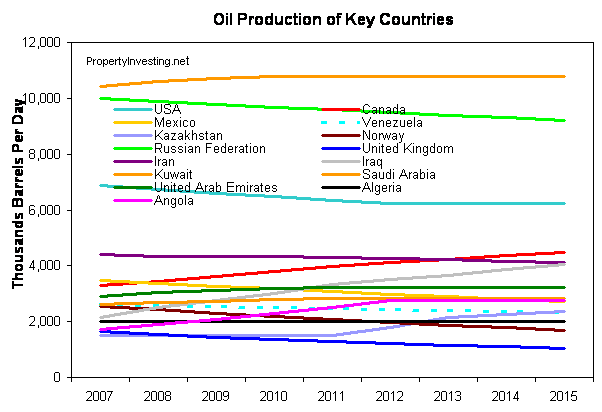
Oil Production of key oil producing nations - forecast: The below chart shows the daily oil production from key oil producing countries - from 2007 (actual) to our forecast 2015 rates. Early reports suggesting Russia has reached its peak oil are probably correct, but it should still be producing a staggering 9 million bbl/day (including Natural Gas Liquies, or NGLs) by 2015 - declining at a 2% per annum rate. We expect Saudi Arabia's production to increase slightly then hold steady at ca. 10.8 million bbl/day - new oil developments offsetting declines in older fields. USA's oil production will continue to decline, but it will still produce some 6.5 million bbl/day by 2015 - if fuel efficiency measures were put in place, the outlook for the USA would be far less bleak. UK's oil production is still significant, representing about half it's usage, but will keep steadily declining up to 2015.
Norway's oil production will also decline, but the low population of 5 million and oil prices at $316/bbl by 2015 - plus gas exports will mean Norway will become even more hugely wealthy - probably the most wealthy country per capita in the world. Investing in Norweign property looks like a low risk safe investment. Their foreign sovereign wealth fund is also hugely successful - so expect the Norweign Krona to strengthen along with property prices.
Canada oil production will rise to double the current level from oil sands developments - we expect the Canadian Dollar to strengthen along with real estate prices all the way to 2015. Calgary, Edmonton and Fort McMurray are highlights, albeit all Canadian cities will benefit - Vancouver included with it's Asia Pacific connections.
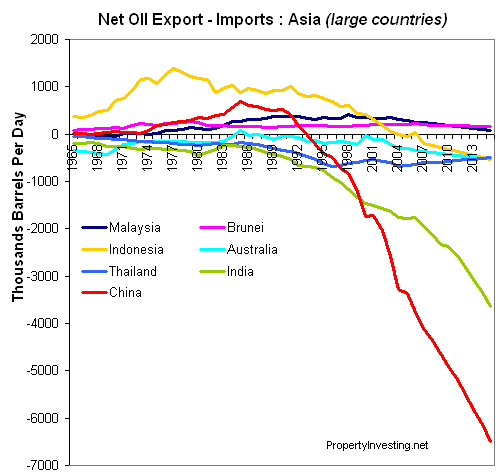
Asia Pacific Net Export-Imports of Oil (Deficit - Surplus) - key countries: The below chart shows the daily oil imports from the largest Asia Pacific countries from 1965 to present, and forecast from 2008 to 2015 (oil production minus consumption). As one can see, China's imports will be a massive 6.5 million bbls/day by 2015 even though we project the country to be producing 6 million bbls/day by this time. Some of these rising raw materials cost must undoubtly feed through to manufacturing factory gate prices and consumer goods inflation globally. India's imports also rise dramatically, and the country only produces ca 1 million bbl/day, so this will be a significant drain on their expanding economy. Indonesia can be seen as an exporter of 1.2 million bbl/day in 1976, but an importer of 0.8 million bbl/day by 2015 as oil declines and the population and consumption increases. Brunei is a big winner - with oil production declining to 160,000 bbls/day - but with big LNG-gas exports and a population of oil 300,000 the Sultanate will become very wealthy (per capita average income of $50,000 per annum by 2015).
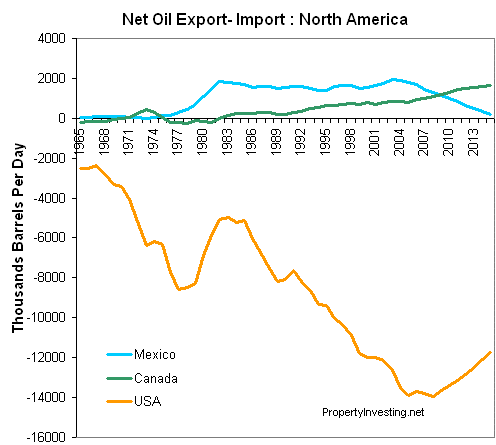
North American Net Export-Imports of Oil (Deficit - Surplus): The below chart shows the daily oil imports for North American countries from 1965 to present, and forecast from 2008 to 2015 (oil production minus consumption). Mexico's oil production is expected to decline whilst consumption increases resulting in net oil imports by ca. 2016. Canadian oil production steadily rises to 4 million bbls/day, whilst consumption is ca. 2.2 million bbls/day by end 2015. USA's imports drop mainly because of energy conservation measures and a stable production rate of ca. 6 million bbls/day from smaller fields onshore and in the Gulf of Mexico.
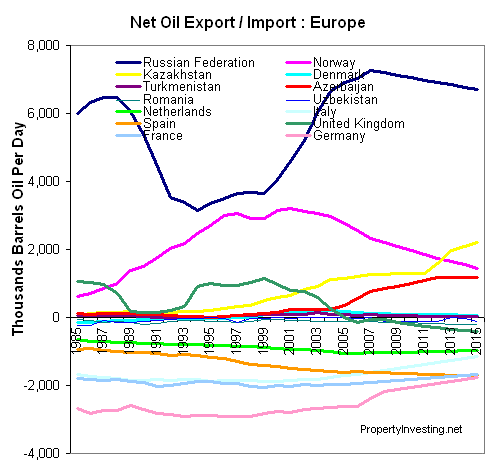
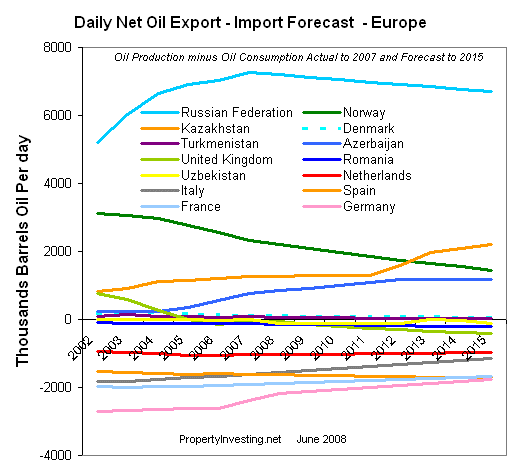
European Net Export-Imports of Oil (Deficit - Surplus): The below chart shows the daily oil exports and imports from the largest European countries from 1965 to present, and forecast from 2008 to 2015 (oil production minus consumption). Russia's exports will remain very high, Norway's will decline, with Germany's consumption dropping as Renewables projects kick-in and UK's consumption will drop but not as fast as the declining production rates. Italy's consumption will drop as recession and a declining population start affecting industry and personal oil consumption. Azerbaijan's oil production will increase as new projects come onstream. Kazakhstan is similar - with a kick in 2012 as as the giant Kashagan field in the Caspian region eventually comes on stream.
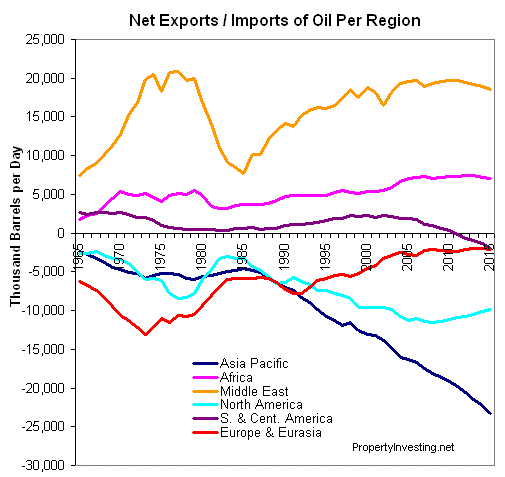
Global Regional Net Export-Imports of Oil (Deficit - Surplus): The below chart shows the daily oil exports and imports from all regions from 1965 to present. No surprize that the Middle East and Africa are the two regions with overall exports, with all others being net importer. We predict Asia Pacific to be importing 24 million bbls/day by 2015 (production minus consumption).
Global Regional Net Dollar Export-Import Deficit - Surplus: The below chart shows the net revenue per region for all regions from 2002 to end 2007 and forecast from 2008 to 2015. This is a simple graphic illustration demonstrating our predicted massive increase and transfer of wealth from oil importing regions to oil exporting regions. Middle East and Africa (oil exporting nations only) are the main beneficiaries. North America does not look as bleak as media coverage makes out - Canada and Mexico, plus USA's indigenous production help prevent too much overall pain - but $1 Trillion lost from the region per annum is a significant sum by 2015 assuming $316/bbl. For the USA, coal and other mineral wealth will help offset the negative impact of high oil prices. This implies gasoline prices should reach $8/gallon by 2015 (from the current $4.1/gallon).
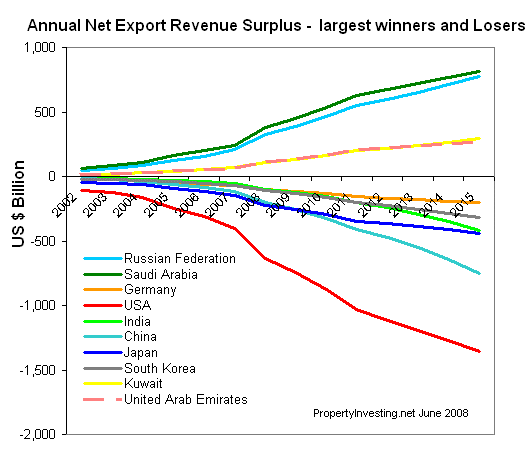
Big Winners and Losers: The below chart shows the net export revenue surpluses and deficits of key countries in the world - what we describe as the biggest winners and losers. Clearly Russia and Saudi Arabia will be exporting a net $0.8 Trillion of oil per annum by 2015. Russia also exports about the same value in gas terms. So Russia will be a new super oil/gas economy with staggering oil/gas wealth. This is why we maintain our buy stance on property in Moscow and St Petersburg, plus Black Sea Russian coastal summer holiday resorts. Kuwait and Norway continue to shine out - with small populations and staggering oil export wealth.
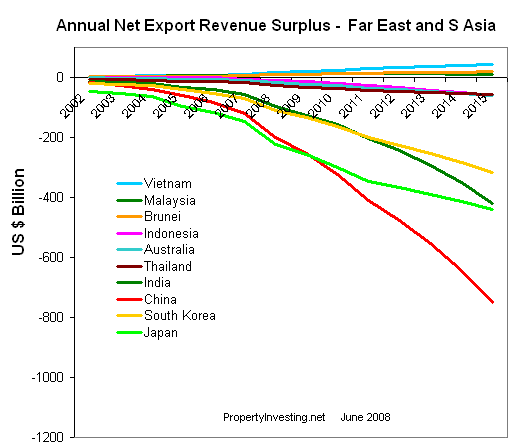
Asia Pacific: The below chart shows the net export revenue surplus and deficits of key countries in the Far East and South Asia - China will be paying $0.75 Trillion for it's oil by 2015 assuming $316/bbl by then. Japan's consumption is curtailed as efficiency improvements are made. Vietnam is a real regional winner - along with Malaysia and Brunei, the only net exporter of oil by 2015. Australia will be importing, but also exports large quantities of LNG, coal and minerals - so we are still quite confident about Australia and their real estate prices in the longer term.
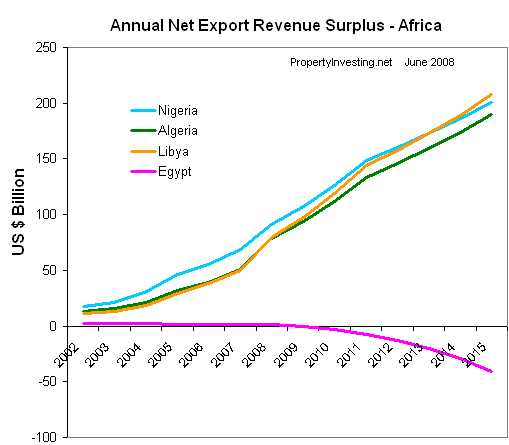
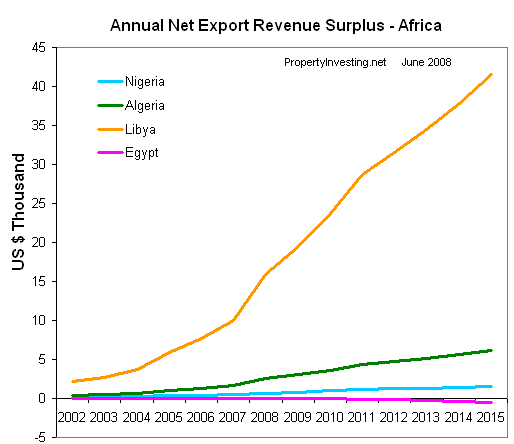
Africa: The below chart shows the net export revenue surpluses and deficits of four key countries in Africa - Libya is an interesting proposition because of it's small population and massively increasing wealth. Worth a watching brief for investment purposes.
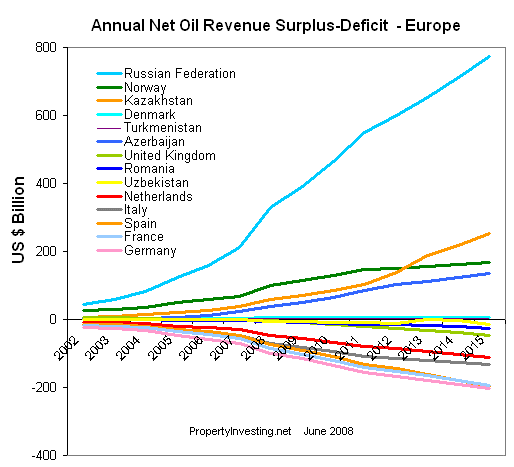
Europe and EuroAsia: The below chart shows the net export revenue surplus and deficits of key European countries - Russia stands out as the big winner. Kazakhstan is another rising star, along with Azerbaijan. Norway remains strong. Both Norway and Russia have massive gas wealth in addition - our predictions suggest they will be hugely wealthy and more influential in the future with massive oil/gas exports to Western Europe.
North America: The below chart shows the net export revenue surpluses and deficits of North American countries - Canada's revenues rise, but Mexico's consumption will almost outstrip its production by 2015 and hence revenues drop. The US situation looks severe spending $1.4 Trillion on oil imports by 2015 - even though consumption drops. Radical ways to improve energy efficiency are probably what is need for USA to prevent such a massive oil deficit - some of these though have already been built into this forecast. 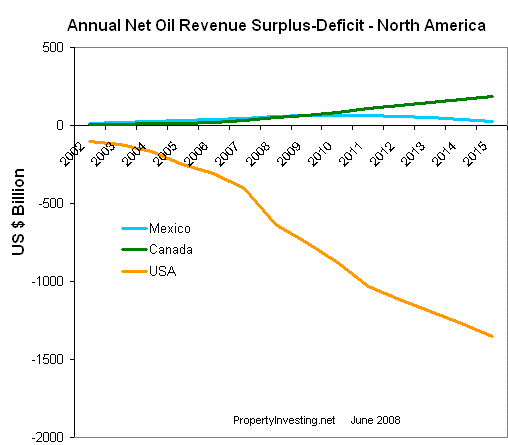
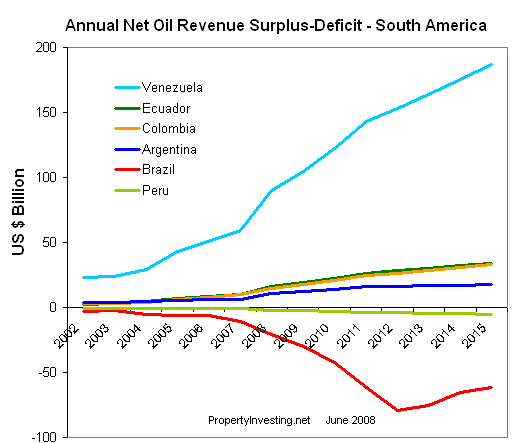
South America: The below chart shows the net export revenue surpluses and deficits of South American countries - standing out is Venezuela which, according to our predictions, will have an oil revenue surplus of some $185 billion by 2015 assuming continued declining oil production and increasing oil prices to $316/bbl. Despite a massive increase in oil production in Brazil, the country will still consume far more than it produces as it maintains rapid industrial growth - hence Brazil will still run an oil deficit albeit it will be a reducing one.
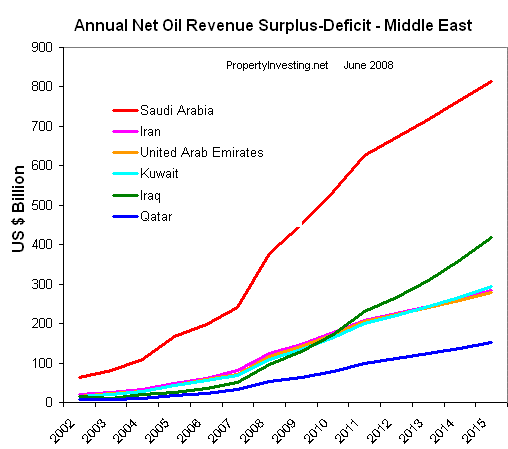
Middle East: The below chart shows the net export revenue surpluses and deficits of Middle Eastern countries - standing out is Saudi Arabia - running an oil surplus of a staggering $0.8 Trillion by 2015. Enough to make it very wealthy, despite it's 45 million projected population by 2015. Iraq will also benefit hugely from increasing oil revenues-wealth and oil production rates. We expect Iraq to produce 4 million bbls/day by 2015 as production increases from its 2004 low rate of 1.2 million bbl/day to 4 million bbl/day - still short of it's potential of some 6.5 million bbl/day (based on oil reserves of >115 billion bbls). Qatar will be super wealthy with it's small population and massive LNG gas and associated NGL oil projects. Kuwait will benefit hugely, as will UAE. Overall - massive wealth creation in the Middle East with Far East, Europe and North America paying.
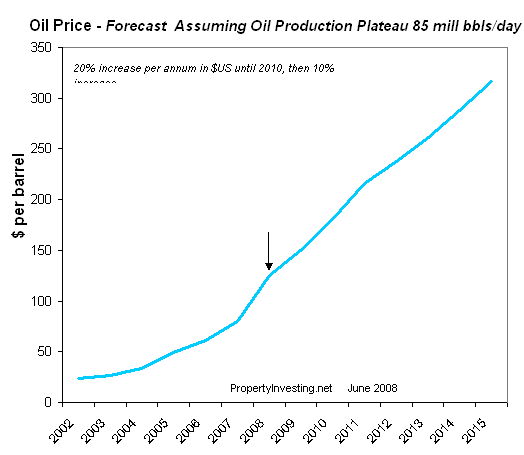
Oil Price Forecast: Our oil price forecast assumes a 20% oil price increase per annum to 2012 then a 10% increase per annum to 2015. Prices could rise a lot higher than this, or be lower - closer to the current $135/bbl - but we believe this prediction is a sound supply-demand prediction rooted in economic, technical and industry fundamentals. We believe it would take $300/bbl to suppress demand to match supply by 2015. In support of this analysis, evidence suggests since oil prices rose from $65 to $130/bbl - OECD demand has only dropped by 0.2 million bbls/day. Developing countries demand has risen 1 million bbls/day. The price of oil is about 15 cents a cup - less than bottled water or Coca Cola. With regret, it will take far higher oil prices to temper demand not a popular message to most people we must admit. But this is what our objective analysis comes up with. And we want our PropertyInvesting.net visitors to get the best facts to back up their property investment strategies. Hence this is our objective view - meant to help, not hinder your property investment decisions.
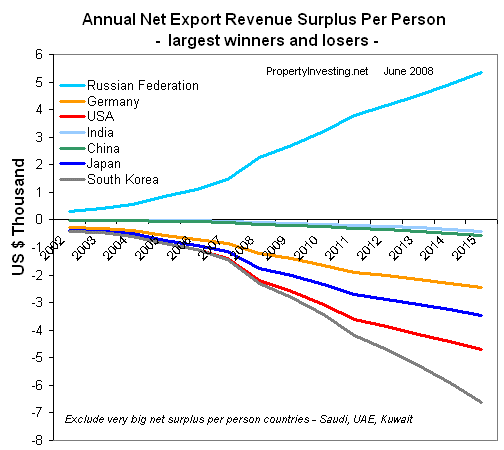
Net Revenue Surplus or Deficit per Person Per Key Large GDP Country: As we move towards 2015, this chart shows how much it will cost each individual to finance oil consumption within each country. South Korea looks very unhealthy - what this means is industrial production-productivity needs to make up for this cost. Since South Korea is highly industrialised, it's still possible it's economy could respond favourably, but it will undoubtedly act as a severe drain - like a tax. Russia has huge revenues but a high population as well - so the financial impact per person is not as high as in countries like Kuwait, Norway and Brunei (in fact, Russia's per capital oil wealth is ten times less than Brunei's). The cost of imported oil for the USA is high - this will create a major drain on the economy without efficiency improvements - may be we will see electric car usage take-off in the next few years (70% of USA's oil usage is for transportation). Airline travel will be curtailed. Long distance commutes lessened. 4*4, big pick-up and Hummvies will be in decline. Fuel efficient autos in demand - just like in 1974 and 1983.
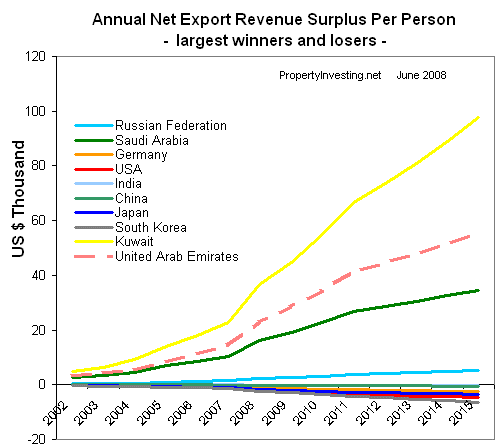
Net Revenue Surplus or Deficit per Person for Key Winning and Losing Countries: This is another cut on the chart directly above - but this time with some smaller countries that will be the big winners - notice the staggering $100,000 per person per annum for Kuwaiti's despite its stable or declining oil production. UAE is also staggering - this off the back of the highly dynamic services economy of Dubai. Looking at these charts, it's difficult to imagine Dubai will not prosper even further in years to come - it is just the start for this booming city. Saudi Arabia will also benefit massively - albeit their population is far larger and services economy more embryonic. Russia's revenues will be massve, but per person, they are far less than the Middle Eastern oil exporting nations. This chart put's into perspective the massive wealth flows into Kuwait, Saudi and UAE per person. Qatar is also massive - and will be one of the richest countries in the world in ten years time from LNG, gas and associated Natural Gas Liquids (oil) production from the gigantic North Field (rough estimate of 1000 Trillion Cubic Feet of Gas Reserves, enough for 300 years of production at current rates).
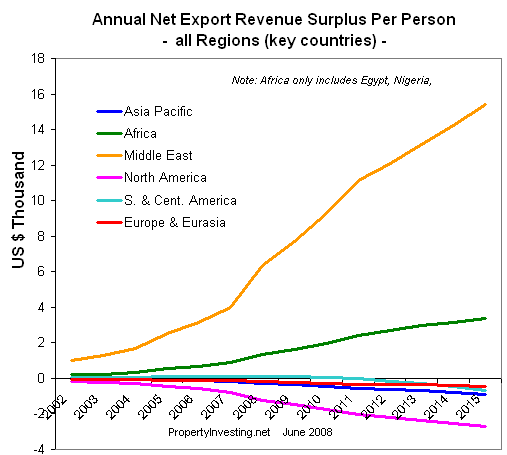
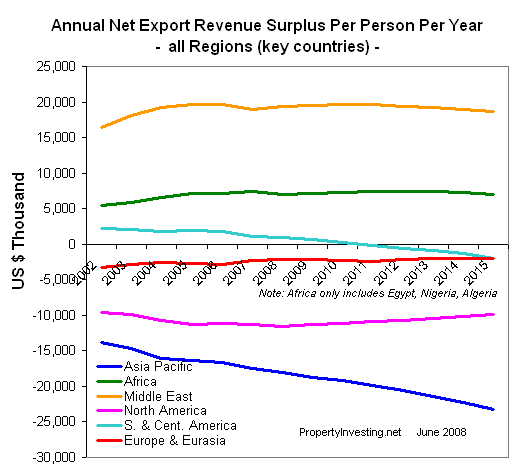
Net Revenue Surplus or Deficit per Person per Region: What we have done here is divided the regional population of the exporting oil nations (only) with the net oil export revenue - and we see on average in countries the Middle East by 2015, each and every person would deliver an oil revenue surplus of $16,000 per annum. In Africa, which only includes Egypt, Nigeria, Algeria and Libya, the revenue is a considerable $2,800 per person per annum. In North America as a whole - that's Mexico, USA and Canada, this figure is a deficit of -£2800 per person per annum.
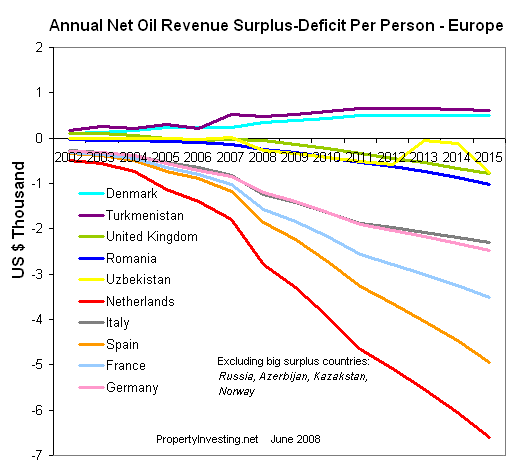
Net Revenue Surplus or Deficit per Person in European countries: What we have done here is divide the net surplus-deficit with the countries population - to get the forecast deficit as oil prices rise to $316/bbl by 2015. Energy intensive Holland and Spain - with no significant oil poduction, fair worst. However, Holland has a lot of gas and oil refining services benefits. But Spain will suffer - one would hope solar power would develop quickly to help with this Spain's pain. The UK fairs quite well because of its oil production and start of conservation measures - this confirms our view that long term, London and southern England are good places to property invest. In addition - much of the global oil, gas and mining wealth is invested from London which boosts property prices in this city. This graph excludes Russia, Kazakhstan and Azerbaijan - they each have large surpluses presented later in the report.
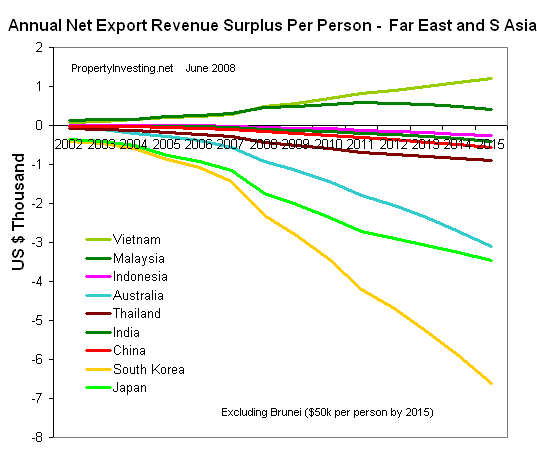
Net Revenue Surplus or Deficit per Far East and S Asia Country : The South Korean sitution looks miserable - they have much oil intensive heavy industry and need to secure low cost alternative energy sources if they can - South Korea may rely far more on LNG in the future albeit these prices are also rising. Japan's oil bill per person is also very high, albeit conservation measures are predicted to help (see the break in slope downwards). Australia will continue to use large amounts of oil - they have coal and LNG-gas, plus minerals, so the oil deficit should not impact the economy in Australia much.
Net Revenue Surplus or Deficit per African Country : Libya is a highlight with small population and growing oil production. Revenue per person is a staggering $40,000 per annum by 2015. Algeria will also benefit. But Nigeria has a very large population and declining oil production - oil revenue may help if distributed correctly, but not to the degree in Libya or Algeria - there's simply not enough to go around.
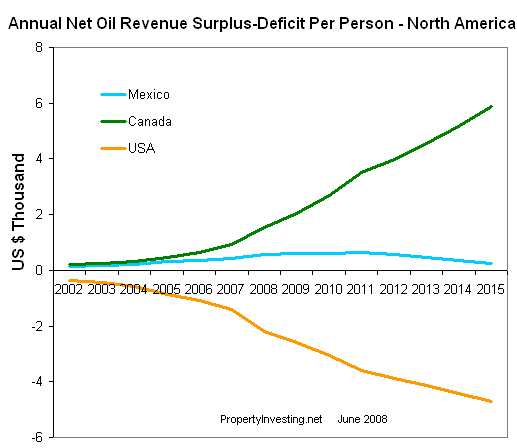
Net Revenue Surplus or Deficit per North American Country : Canada is a clear winner - with each person gaining on average +$6,000 per annum by 2015. Mexico will be broadly neutral as oil declines, population rises and oil consumption rises. The US situation will worsen - albeit the slope will get slightly less steep as oil conservation start, and more onshore and offshore oil developments progress - the issue still looks like a big one though and will likely depress the US dollar value moving into the next decade. Coal and mineral wealth and a huge services economy should help, but a drain of $5,000 per person per year is very high even for super rich USA. Since GDP per capita is currently ca. $50,000, this is like a 10% additional income tax for everyone in the country.
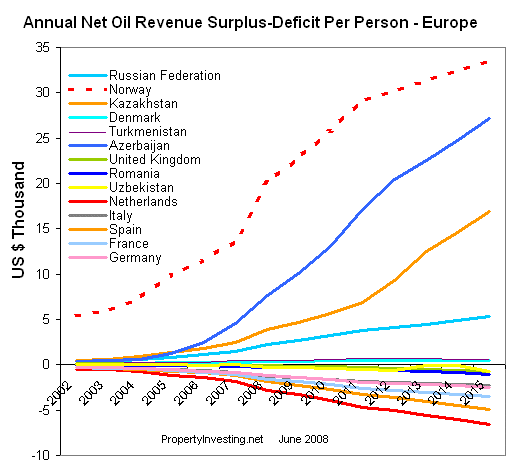
Net Revenue Surplus or Deficit per European Country : This chart includes the massive oil producing countries of Norway, Russia, Azerbaijan and Kazakhstan - these countries are clear winners for property investment. Go to Baku now and expect it to look a whole lot more wealthy in ten years time. Almaty in Kazakhstan is the same. It's common economic sense - if Buka gets $28,000 per person per year of oil revenue from a base of just $500 per person in 2002, it doesn't take a rocket scientist to predict property prices will rise unless large instability occurs within the region. The country has a stable low population base, massively increasing oil production and massively increasing oil prices - all from a low base - a winning investment combination for property. And it's overlooked so far. These are the types of investment insights we hope will help your investing strategies.
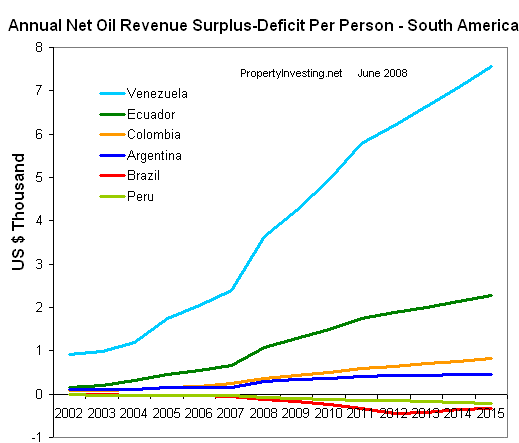
Net Revenue Surplus or Deficit per South America Country : Venezuela is the clear winner despite it's reasonably large population. Despite declining oil production, individual wealth will rise dramatically from $1,000 in 2002 to $7,000 per person per annum by 2015. Ecuador is also a winner despite declining production - the low population helps. Despite all the hype about Brazil's big new oil discoveries, these will take many years to develop, are technically very challenging and because the country has a large population and imports oil, the benefits will only be to prevent it from developing a large oil deficit per person. Not to say Brazil is not a good place to invest in, but the oil revenues have to go around many people - it will protect the country from high oil prices which is a great benefit.
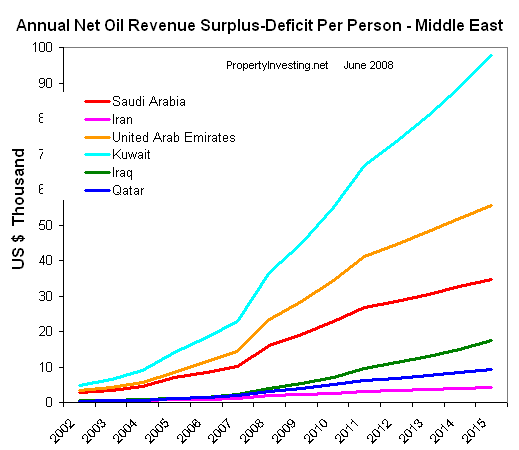
Net Revenue Surplus or Deficit per Middle East Country : Kuwait is a winner - with wealth per person rising to almost $100,000 per person per annum by 2015 assuming $316/bbl by then. Obvously this is a massive number - property prices will surely rise in Kuwait City as long as the region maintains stability. Iraq will develop into a nation that benefits markedly from oil wealth - things could look very different by 2015 as the country rebuilds. Saudi and UAE are obviously going to prosper -Abu Dhabi, Dubai and major Saudi cities all look attractive for commercial and residential property investment if the region maintains stability - the oil wealth should help with this process.
Net Revenue Surplus or Deficit per Region: No surprise the Middle Eastern oil exporting countries are the winners, followed by African oil exporting countries (Libya, Angola, Nigeria, Algeria). Europe has many losers - but Norway and Russia are the key winners. UK fairs okay because it supplies half it's oil needs at least, and some of it's gas.
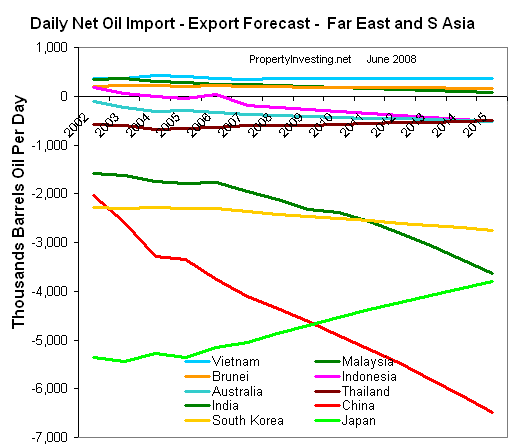
Net Oil Surplus or Deficit per Far East Region: We can see China's massive forecast growth in oil consumption in this chart below, despite our forecast oil production increase. By 2010 they will import more oil than Japan. India's deficit increases as consumption increases and oil production remains stable. South Korea's consumption increases as industrial production rises - S Korea has no energy - it imports all its coal, oil and gas/LNG so is quite exposed to high oil, and linked gas and coal prices. Japan is forecast to reduce its oil consumption as efficiency measures take place and it economy further matures - with heavy industry moving overseas. Overall we are optimistic above China's property prices - since the manufacturing industrial base is so strong, China can afford high oil prices. India is likely in a similar position - as education and training improve, services and knowledge based industrial growth takes hold, the low wage costs will offset high oil costs and the economy should still prosper - and with it property prices. It's the inefficient developed economies with high wages, social costs, declining populations and early retirement with high energy intensity that we need to worry about - that's why we are so cool on Italian and Greek property (possibly Portugal as well) - these countries all have declining-aging populations with lower employed workforces paying for many retired citizens.
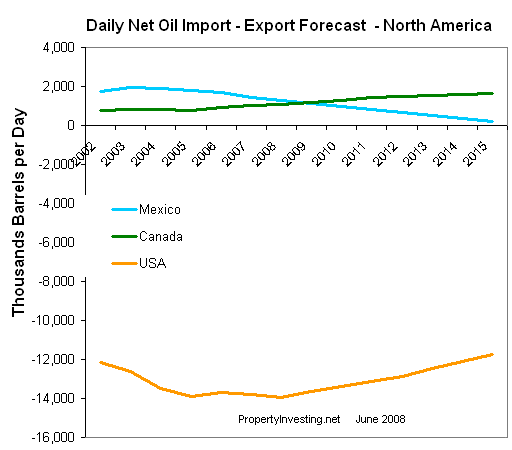
Net Daily Oil Imports - Exports - North America Region: Canada's net oil exports rise to 2 million bbls/day (it will consume 2 million bbls for it's own needs by 2015). US oil imports will slow as oil prices start to bite into demand and energy efficiency measures are enacted. Oil production should also rise slightly as smaller previously marginal oil fields come on stream (e.g. Bakken Formation in Texas, smaller Gulf of Mexico discoveries and possibly Oil Shale in North Dakota-Colorado-Wyoming areas). Mexico's demand rises whilst its production drops - sorry to say by 2016 we predict Mexico will be importing oil.
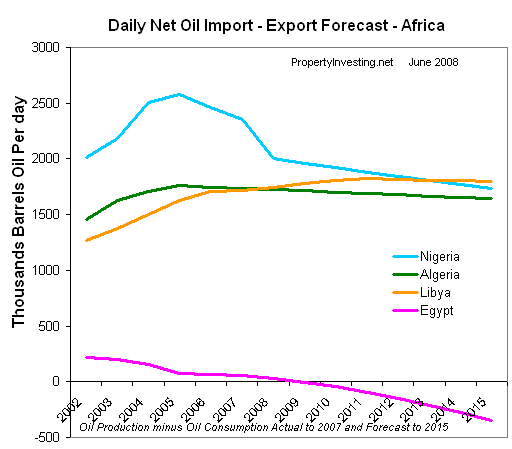
Net Daily Oil Imports - Exports - Africa Region: Nigeria's oil exports will likely drop - if one assumes continued troubles in oil producing areas. Nigerian oil consumption also rises. We predict Libyan oil production will rise to about 1.7 million bbls/day then plateau. Algerian oil production should also rise, but then start a slow and steady decline. Egyptian oil production actually rises, but consumption rises even faster - hence it starts importing oil around 2009. Egypt also exports quite a lot of gas, so we are still quite opimistic about Egyptian property prices - neighbouring Middle Eastern wealth will be invested in Cairo and holiday resorts - knock-on impact of being neighbours to Saudi Arabia should help.
Net Daily Oil Imports - Exports - Europe Region: Russia's oil production starts to decline from January 2008 onwards - but at only at 2% per annum. Norway's oil poduction declines but the country only has 5 million inhabitants, so wealth will still be huge because of oil price increase. Gas exports will also stay high from Norway - a winner - stable, honest, hugely wealthy, stable population, high educated workforce - nice people as well.
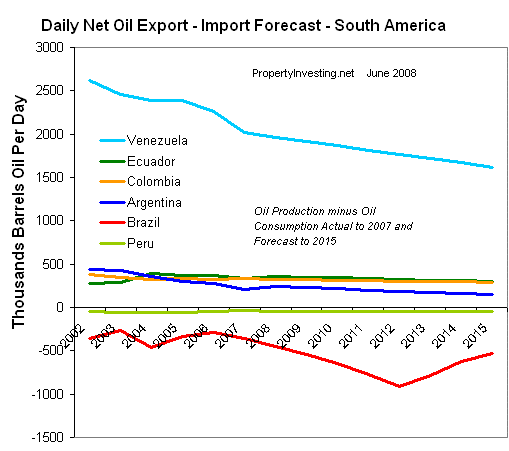
Net Daily Oil Imports - Exports - South America Region: We believe Venezuela's production will continue to decline because of lack of investment, but revenues will massively increase all the same. By 2012, Brazil will see new production coming on-stream, hence it's imports will go down. Up until then, it's consumption should increase more than it's production.
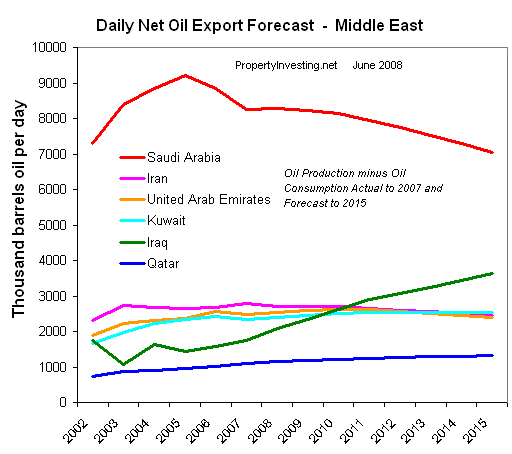
Net Daily Oil Imports - Exports - Middle East Region: We believe Saudi Arabia's net oil exports will drop further. Despite it's production assumed to rise then stay stable at 10.8 million bbls/day, it's exports drop because of it's massvely expanding population using liberal quantities of it's own indigenous oil - this will likely start to accelerate through to 2015 as the country industrializes further. Iraq is the only Middle Eastern country we predict that will have any capacity to significantly increase it's oil "exports". All other countries would need to invest far more than they currently are to develop new oil fields - the pace of development simply is not fast enough to boost export levels significantly. No use asking OPEC to increase production - even if it was possible, it probably still would not happen because incentives to invest are not high enough. An no-one mentioned - they need the oil themselves! If you lived in a hot desert - you'd want air conditioning, big car, airy home and the luxuries - and one needs oil for such activities. In addition, any economist can see that the value of oil today - if they forecast as we do - is low compared with it's future value - these circumstances would logically lead to projects not being accelerated - but rather delayed (e.g. the value of the oil in the ground is forecast to increase at more than the investment discount rate used). The fear of western countries developing alternative energies to replace oil is probably a red herring - we'll always need oil. So demand will stay high and so will prices. Not a good news story, but the truth.
Global Oil Consumption and Production: According to our detailed mathematical model for supply (production) and demand (consumption) built for every country in the world - demand is forecast to rise far higher than supply. We expect supply to drift upwards to 85 million bbls/day (from 82.5 million bbls/day) by 2015 - but this is not fast enough. Demand should increase by 1.3 million bbls/day per year - whilst supply by only 0.4 million bbls/day - the only way to reduce this gap is for oil prices to increase to curb demand. It's simple supply-demand economics. Because oil demand is so inelastic e.g. it does not respond well to high prices, we see oil prices skyrocketting. Sorry, it' the painful truth. Hence our base prediction is for oil prices conservatively to rise to $316/bbl by 2015 - with a 20% increase per annum at least for the next few years. This should help curtail demand to the supply levels - there is a chance it still does not temper demand and prices skyrocket higher a lot earlier - a possible panic and a spike well over $200/bbl in late 2008, 2009 or 2010. We believe fundamental oil prices need to move higher, otherwise demand growth will not decrease with China's and the developing nation's demand growth.

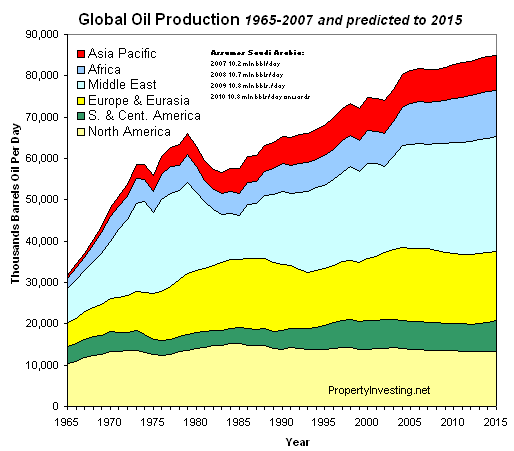
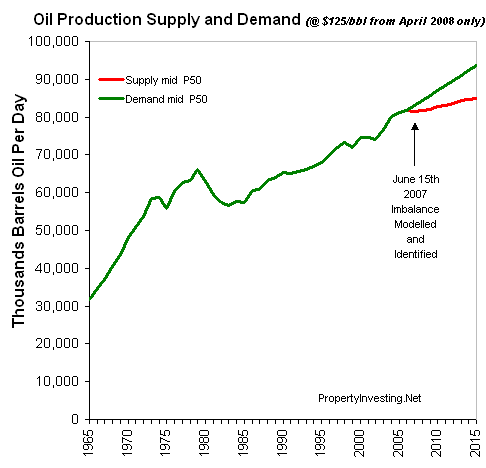
Global Oil Consumption and Production: This chart shows supply all the way back to 1965 as context, up to late 2007, with forecast from early 2008 to 2015. This is based on our unique detailed mathematical model based on technical fundamentals. Overall, half of all known oil reserves based on $125/bbl oil price have been produced - normally at this stage, one would expect oil supply to start a progressive decline - non as "Peak Oil". We believe - based on our model, that oil supply will struggle to rise further, but will do so since oil prices have risen ten fold in nice years - which will stimulates a certain number of new developments to come on stream. But in 1972, 70% of oil was privately developed by companies - now only 18% of oil is accessible to these same independent oil companies. Most oil is state controlled by National Oil Companies. Russia, Venezuela and Bolivia are examples of countries that recently nationalized parts of their oil businesses. We frankly do not believe incentives are high enough for new oil developments - furthermore there are skills and equipment shortages. Most projects encounter delays. Oil will eventually start a decline - it could even be just around the corner if one or two country's drop exports because of war, instability or curtailing of oil investments. Our prediction has a 50% probability - to review the other scenarios - the error bands - refer to the next chart below.

Global Oil Demand (Consumption) and Supply (Production): This chart shows uncertainty brackets around our supply and demand forecasts assuming $125/bbl oil price. In most cases, oil demand outstrips supply - this should of course lead to higher oil prices. We don't believe from now onwards higher oil prices will lead to much extra oil production coming on-stream mainly because 82% of oil is state controlled and not subject to the accelerated production common with independent private oil companies and non state controlled producing nations. We produce 31 billion barrels of oil a year, yet only find 5-10 billion barrels. Cheap oil is running out. All remaining cheap oil is under state control - mainly onshore. New oil is in harsh environments - offshore, deep, artic, high temperature/pressure, sour etc. These new developments take 10 years to come on stream. So it's already too late - apologies for another sorry truth.
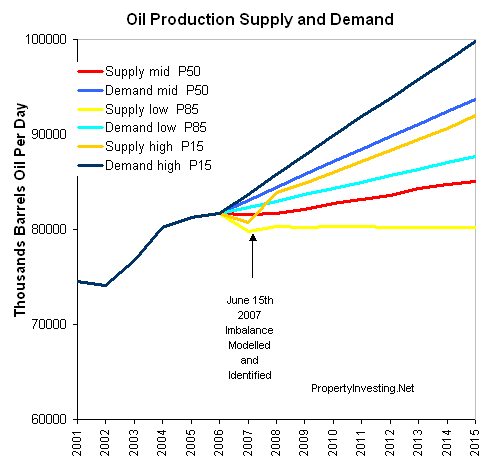
Global Oil Supply from 1965 to present with forecast to 2015: The good news - we predict oil production increasing globally (barring major supply disruptions) up to 2015. The bad news for oil importing nations - demand will outstrip supply. The chart shows the massive increase in oil supply-demand since 1965 - it took 150 years to produce half our reserves, but it will only take 35 years to produce the remaining half. All we are doing now is accelerating the oil to push the peak out towards 2015, but at any time, it can start the drop - and when it does drop - it can drop quickly, suddenly and in a manner that no-one can control. If we accelerate, the drop becomes steeper. Thousands of oil fields show this behaviour - another truth. It's oil in the earth and no amount of technology will prevent an oil decline when it starts. There are very few examples of countries that have arrested and reserves after oil has started a decline - the same will be true for the world. So expect the decline to start - probably some time around 2015 (or sooner if supply disruptions take place). But if it start, don't be too surprised if it drops rapidly - most oil fields do, most countries oil production has, and there is not reason with accelerated global oil at $130/bbl that the same will not happen to the world.
