158: Supply and demand scenarios - oil boom and the property investors insights
09-08-2007
PropertyInvesting.net team
Weve supplied some insights into aspects of the oil and energy business that can be used to give  property investors the best insights into:
· How to hedge for when the big oil price hike comes
· What areas to avoid and which areas to gravitate to in case price rises
· Boom town areas
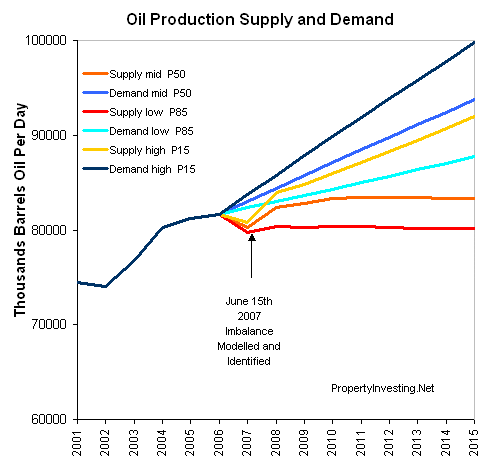
Oil Supply - Mid Case: Weve now gone a further step forward - we have done an analysis of all oil producing countries historical production. We then went through every country and have predicted the actual maximum reasonable production they can achieve from mid 2007 until 2015. This assumes:
· Current trends in production decline and growth in countries
·
· No major disruptions occur and no major large discoveries
This is what we call our mid case our P50 expectation level of oil production. Its most likely to be rather optimistic it assumes OPEC are able (or want to) increase production and

Oil Supply - High Case: We then modeled a high case production scenario in which every country that has growing production was able to grow at an additional 1% per annum up until 2015 a tall order. It also assumes
Oil Supply - Low Case: We then modeled a low case production scenario in which every country that has growing production was able to grow at a 1% slower growth rate per annum up until 2015. It also assumes Saudi Arabia is only able to ramp up to 10 million barrels a day and maintain this plateau some people believe even this might now be a tall order. We then took every country that has declining oil production (mostly around 3-5%) and increased the decline rate by 1% - so instead of a say 4% decline per annum, the country would decline by 5%. All these downside are a little pessimistic, but if any supply disruptions occurred, large fields started to water out or have other technical difficulties, or a global recession caused demand to weaken, this scenario may pan out.
Demand Forecast Mid Case: We then overlay the EIA official global oil demand forecast. This assumes demand rises by 1.37 million bbls/day up until 2010 and then 1.32 million bbls/day from 2011 until 2016 using current GDP projections.
Demand Forecast Low Case: We modeled a low case in which demand only increase 0.66 million bbls/day (50% of the forecast growth) most unlikely in view of the booming Indian and Chinese economies, increasing population, massive increase in car and truck usage and the increasing global population.
Demand Forecast High Case: We then modeled a high case in which demand increases by 2.1 million bbls/day until 2015 (a 50% increase over the EIA forecast), in recognition of the booming Indian and Chinese economies, increasing population, massive increase in car and truck usage and the increasing global population. Because gas/petrol prices in
Conclusion
 Depressing. It shows that the demand and supply curves do not cross unless demand was weaker than expected and supply was far greater than expected. It all points to a rapidly increasing oil price. This analysis has taken years to prepare. Many years of experience both technical, economic, social and political to achieve these forecasts. They are objective, impartial and meant to help our property investing community prepare their portfolios for the oil price shock to come. But for our website readers, we hope it will not be a shock. These numbers are the clearest reflection of the underlying supply and demand picture we can ever hope to achieve. We expect our prediction to last the test of time. This Special Report will stay on our site for years we do not do these predictions light heartedly.
Our best guess is that production will plateau out at 83.5 million bbls/day whilst demand will continue to rise. When demand is 5% higher than supply, oil prices in theory should double. So our base prediction is that this imbalance will have occurred by end 2008 when oil prices will have risen to $125 / bbl. It will however not have constrained demand in
This is when
There will be a massive transfer of wealth from consuming (non oil producing) countries to oil exporting countries. When the cat finally gets out the bag and the markets realize that
And in the

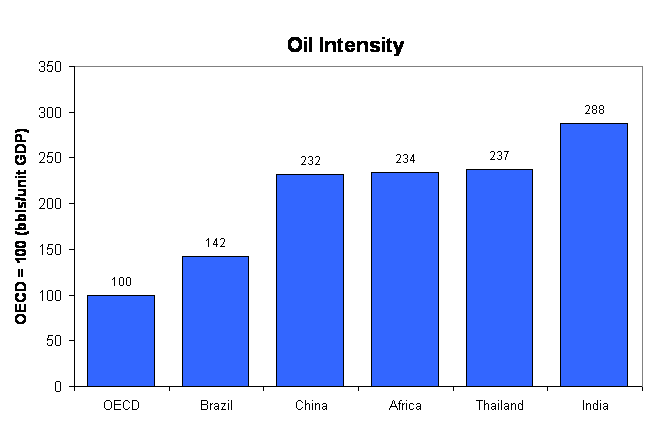
So for the property investor, its best to avoid energy intensive countries without oil. This chart shows how much oil is used to produce a GDP unit. Africa,
So the winners in the Peak Oil era or "high prices oil world" will be:
·
·
·
·
·
·
·
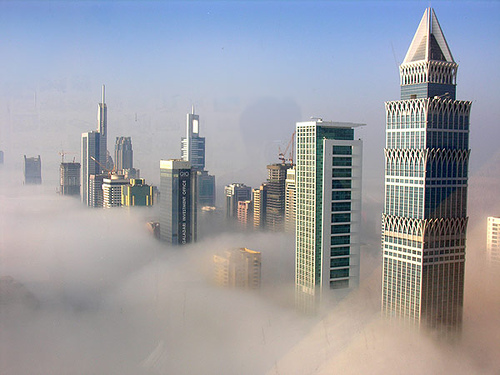
· UAE
·
·
The losers will be:
· All African no oil producing countries
· All South American on oil producing countries
·
·
·
· All poor countries without oil
·
·
·
·
·
·
·
·
·
 As previously advised, the winning cities in the next oil price shock will be:
·
·
·
·
·
·
·
·
·
·
·
·
· Bo Hi Bay
· Sarawak
So dont say we did not warn you.
 A few other things to consider make sure you don't buy property in far flung out-reaches which rely on long haul airline travel or more than 2 hours car drive to a major city. If petrol or jet fuel prices sky-rocket, whole economies and regions will be negatively affected dont be in one of these areas! If you are a
And if you think oil is expensive think again in the
We hope you have found this Special Report insightful and it prepares you for the coming oil shock. If you have any comments on the analysis, predictions or insights, please contact us on enquiries@propertyinvesting.net, or write something our Weblog.

