137: Portfolio equity increase modelling - based on UK property shortage
06-10-2007
PropertyInvesting.net Team
A new
The report goes on to predict that by 2026, the least expensive quarter of homes will cost 10 times the average income of the poorest quarter of the population. The figure is now seven times the earnings of the poorest 25 percent of the population on average. At the high end, it is already at eight times the earnings of that segment of the population in
The predictions made by the report hold, it says, only if the number of houses built rises to 190,000 per year for the next ten years, from the 168,000 per year being built currently. The report estimates, based on government projections, that between now and 2030 there will be 223,000 new households created in the
The chairman of the new unit, Stephen Nickell, admitted that the forecast is just that. He noted, however, that current conditions point in the direction of more house price growth. He also said that while house price growth could slow if interest rates rise, the boom is not likely to crash.
The National Housing and Planning Advice Unit is an independent, advisory non-departmental public body accountable to Parliament.
To put this report into context for the UK based investor, PropertyInvesting.net's long term view is that, with inflation running at 3% and wage inflation at 4%, this continued shortage of housing (by approximately 33,000 to say 50,000 homes a year) will support house price growth at above the level of average earnings growth – we conservatively put this at 2% above earnings growth per annum for the long term. The other way of looking at it is to ask the question "why shouldn't this be?". It's not unrealistic to see house price increasing at 2% above wage/earnings growth. House price multiples to earning should continue to increase and banks would likely continue to relax lending criteria, particularly to low risk employees with professional jobs – this is predicated on continued stable economic conditions and similar employment and unemployment levels.
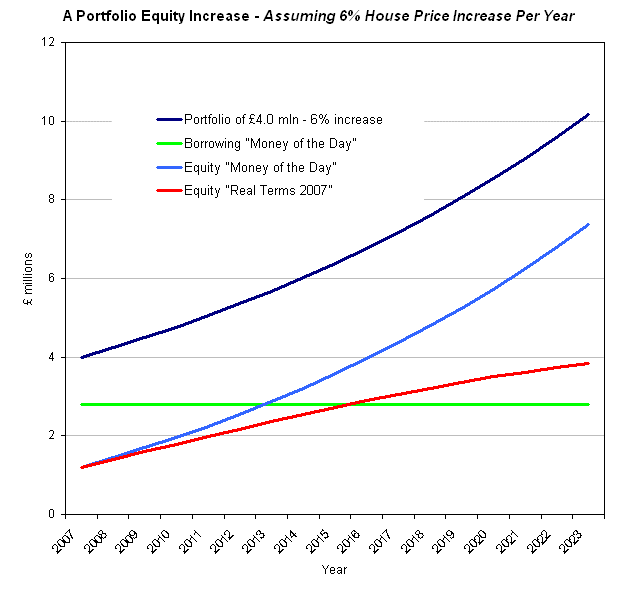
The below graph is derived from a model that assumes a portfolio worth £4 million - for illustrative purposes (you can divide by 10 if you have a portfolio worth £400,000). The borrowing on this portfolio is £2.8 (green line) – and it is assumed this does not rise, or fall in “money of the day terms” – e.g. interest payments only are made. If prices rise by 6% per annum from 2007 until 2023, then the “money of the day” equity rises from £1.2 million to £7.5 million (medium blue line). In real terms 2007 £ pounds, this value would be equivalent to £3.9 million in today’s money (red line). So, an investor who does not grow his/her portfolio, and only holds their £4 million valued property portfolio would see their equity more than triple in size by 2023. Any wander why investors are not selling up – as long as not enough homes are being built and the economy is reasonably strong, then there looks to be long term profits that can be realized by investing in

For now, we have not modelled an investor adding to their £4 million portfolio – suffice it to say, the lines would go off the graph – sky-rocketing up – a net worth of £10 million by 2023 would not be unrealistic for a medium growth strategy, though the amount of properties in the portfolio could reach a potentially unmanageable 30-50 properties depending on UK region.
More and more younger people will be renting from ever increasingly wealth landlords. This wealth will then be inherited by children, who may well follow their parent into buy-to-let (with the Chancellor receiving their ca. 40% of the proceeds!) – you can see why the inheritance tax threshold is not rising. And why the Chancellor is comfortable playing the waiting game – if he does not get the 40% by capital gains tax, he’ll get it via inheritance tax. Sometimes he might even get both!

