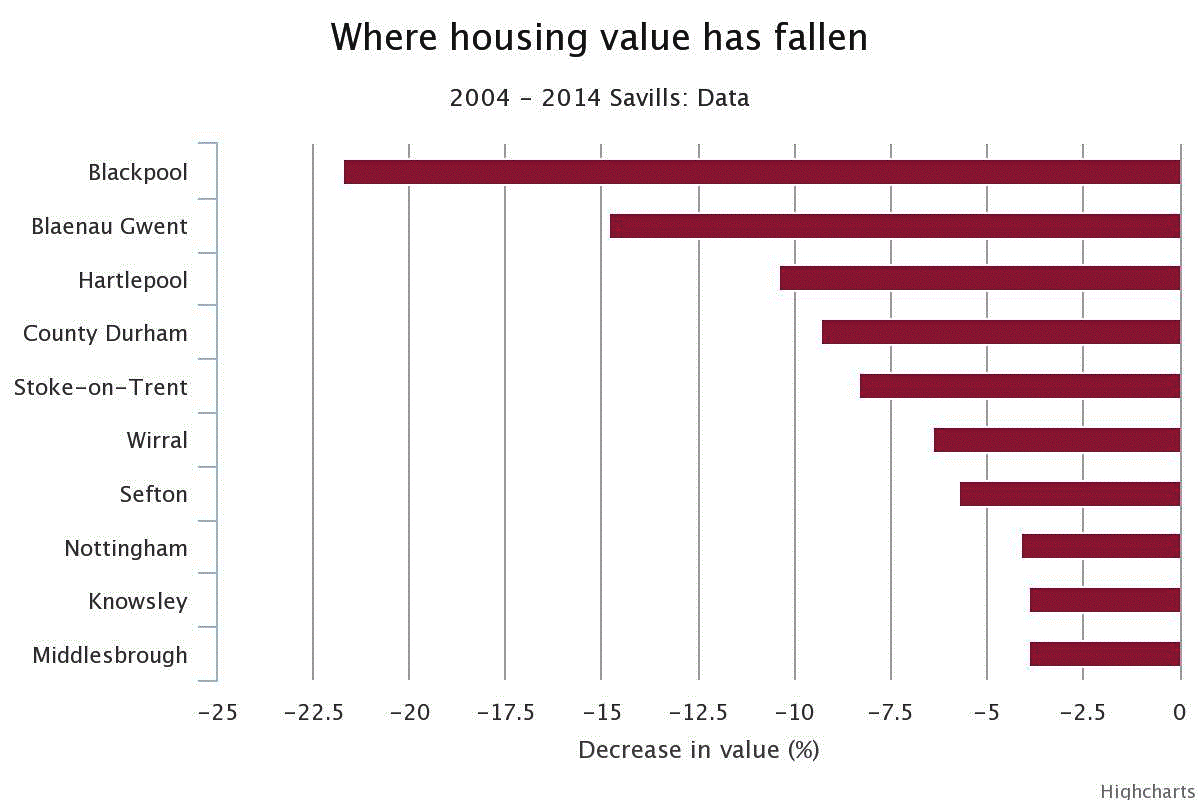
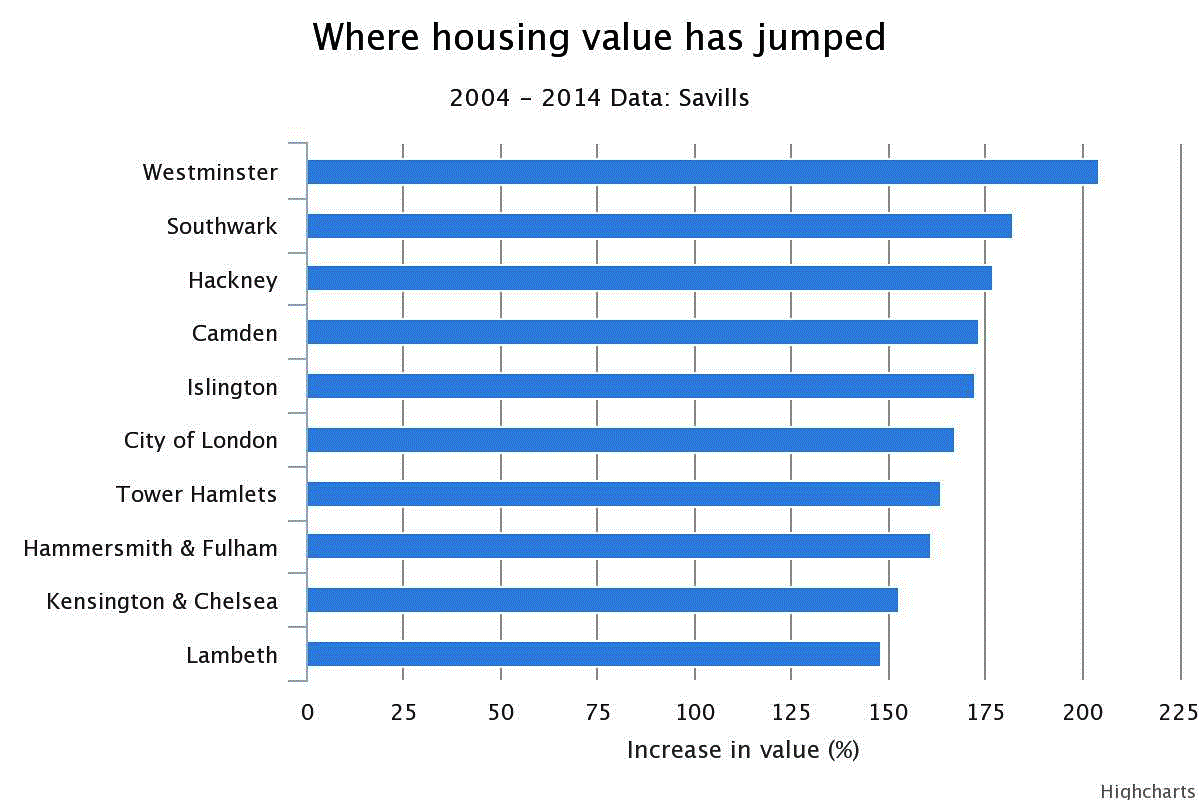
New analysis, which has measured the collective worth of all homes in England, Wales and Scotland and cut it by local authority, has revealed which areas have seen rocketing house prices over the past decade and which have been untouched by the 2006/2007 housing market boom and, latterly, the recovery.
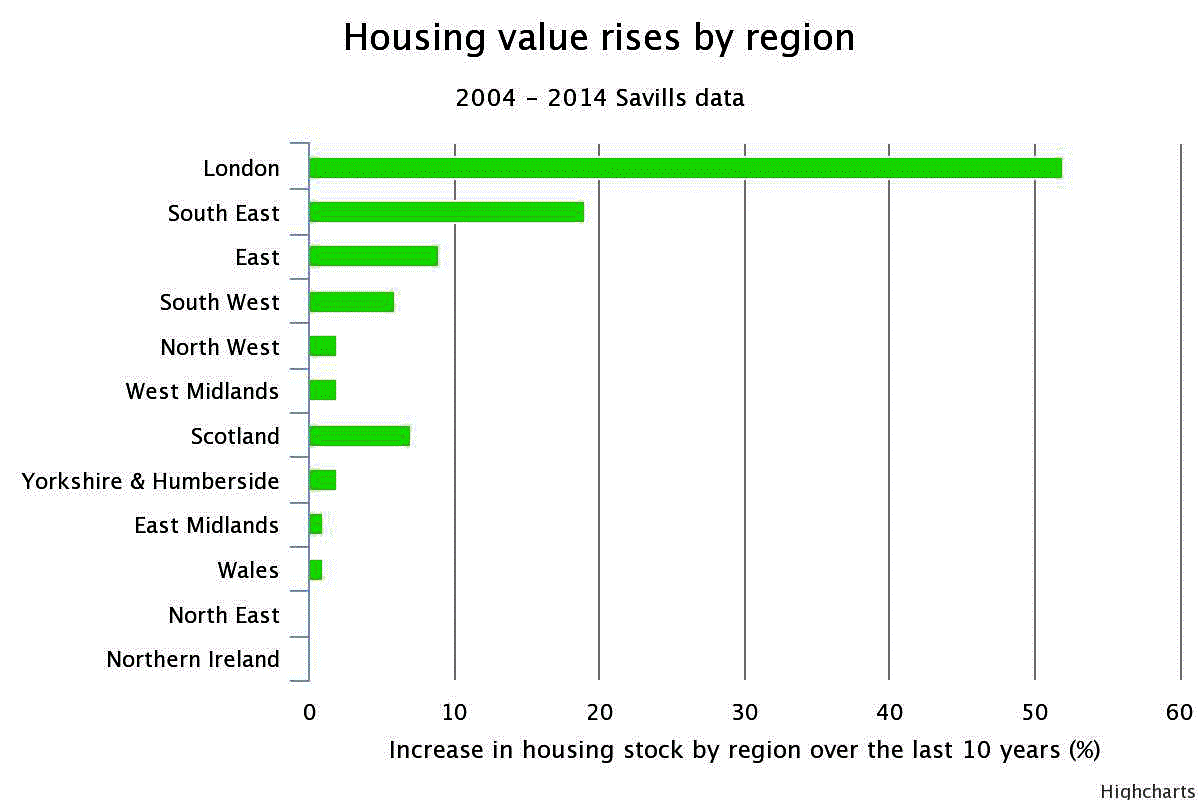
More than half of Great Britain's total growth occurred in London, where the total value of housing stock has doubled, rising by £741bn, according to Savills' data, which took into account prices and the density of homes in order to put a value on Great Britain's homes.
A further 19pc of the growth (£270bn) comes from the South East, where the housing stock is now worth more than £1 trillion after a wave of commuters sold up, cashed in on London house prices and upsized into the home counties.
First-time buyers are also prepared to buy in the commuter belt rather than the capital to get a foot on the property ladder.
In stark contrast, the total value of housing across the North West, North East and Yorkshire & Humber has only risen by £42bn, contributing to just 3pc of the value growth of UK housing stock over 10 years.
The growth in the total housing in London and the South East has been 12 times that of the Midlands and the North.
"Economic growth has been in the larger cities, and those areas with a high proportion of public sector jobs have had a tough time. The North East is a relatively small economy with a high reliance on the public sector. Therefore, while there are some individual success stories (the Nissan plant in Sunderland) the underlying trend has been relatively gloomy – depressing house prices," said Nigel Wilcock, regional development director at Mickledore.
"The other thing is that even if the public sector hasn’t shed as many jobs as was perhaps feared – the threat of losing your job has reduced confidence. This loss of confidence has the same effect in things like the housing market."

Outside London, the local authority area in England and Wales to see the biggest increase in value over the past 10 years was Epsom and Ewell in Surrey.
Reigate and Banstead came second in the ranking, followed by Brighton and Hove.
When excluding the capital, the ranking is dominated by areas surrounding London, with West Oxfordshire also featuring.
In Scotland, the total housing stock in Edinburgh has jumped 33.8pc to £11.5bn over the decade to 2014, while Aberdeenshire, fuelled by the oil sector, grew 58.2pc to £7bn.

“Our analysis...demonstrates very clearly that housing wealth has become increasingly concentrated in London and the South, the flipside being that affordability issues for those hoping to get on the housing ladder are most acute in these areas," said Lucian Cook, head of residential research at Savills.
“By contrast, an absence of price growth in certain other parts of the country means that homeowners have struggled to build up the same amount of housing wealth. This has meant, for example, that house price growth has been much less of a driver of consumer spending.”

Using the map
The interactive map above shows the increase in total value of housing stock per local autority area over the 10 years to 2014.
Hover over each local authority to see the total 10 year change in value.
Click on each local authority to see the % change in value.
Click on the "visible layers" button in the top-right-hand-side of the map to change the settings from showing the 10-year change, to showing total value or the one-year change.
Map by Andrew Smith, analyst at Savills UK


