The housing crisis in charts
02-09-2015
An in-depth look at the numbers that have brought us to this state
Britain’s housing crisis. Photograph: David Levene/Guardian
Hilary Osborne and Paddy Allen

From tenants battling on a London housing estate to keep their affordable homes to celebrity interventions over the mansion tax, the cost of property and who owns it has been in the news time and again over the past year.
The subject encapsulates many wider issues, from the impact of high living standards on the younger generations and the vulnerable to concerns over high personal debt. But the causes of these problems, including the number of homes being built and the council house sell-off, have been building up for years.
In some areas of the country homes now cost almost nine times local salaries, and those who will never be able to afford to buy or rent privately are on council house waiting lists with more than 20,000 other people.
These seven charts show some of the reasons why we are in a housing crisis. The biggest problem is that the UK is not building enough homes, but pressure has been put on the housing stock by other factors too.
1. Average cost of a UK home
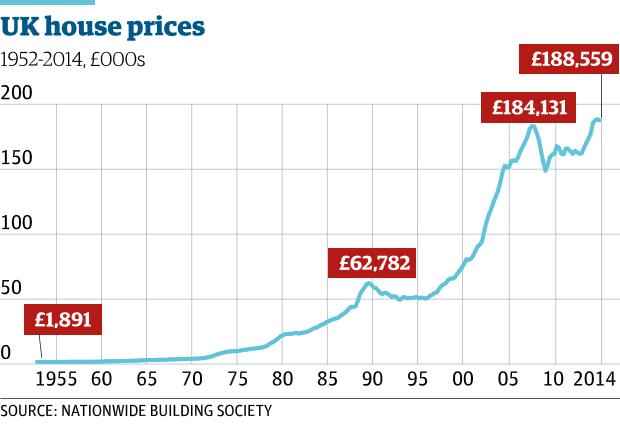
Graph shows average UK house price based on Nationwide’s mortgage approvals
The house price index published by Nationwide, the UK’s biggest building society, goes back to 1952. Back then, the average UK house changed hands for £1,891. It didn’t move much for a decade until the first instance of double-digit price growth in late 1963. Then in the early 70s the first boom years arrived. In the second half of 1972 annual price inflation was running at above 40%. Fuelled by the deregulation of the mortgage market and tax relief for borrowers prices didn’t fall until the crash of the early 1990s. The average house price hit £188,559 in December – almost exactly 100 times the level that the index started at.
The society has a series showing “real” house prices too, adjusted for inflation. That shows that once inflation is taken into account, prices are below the previous peak of £228,986, reached in the third quarter of 2007, but have more than doubled over the past 30 years.
2. Average cost of a first-time buyer home relative to earnings
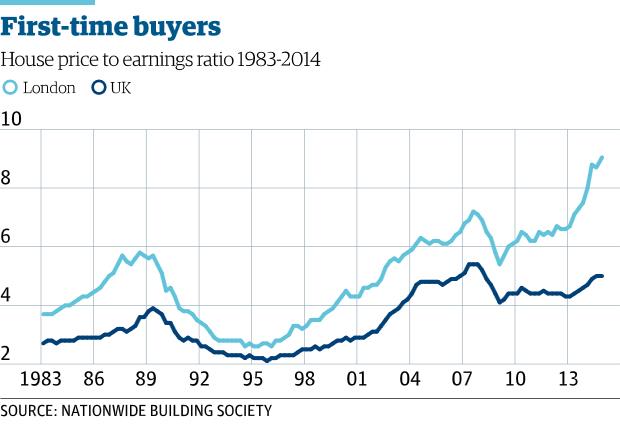
Graph shows cost of typical first-time buyer property relative to local full-time incomes.
House price increases are less painful for aspiring buyers if they are accompanied by rising salaries. For much of the past 30 years, the earnings of first-time buyers have kept pace with the cost of buying a first home, according to Nationwide. But in the run-up to the last housing boom prices broke away from earnings. Immediately after the crash, the amount you needed to raise to buy a home dropped off, but it has never returned to the levels seen 11 years ago, when a home cost less than four times average salary. In London, despite a slowdown in house price growth, first-time buyers are spending nine times their salary on homes on average. With interest rates low, monthly mortgage repayments are relatively affordable, but the Bank of England is sufficiently worried about the disconnect of prices to wages to limit lending at more than 4.5 times salary.
3. Number of homes created
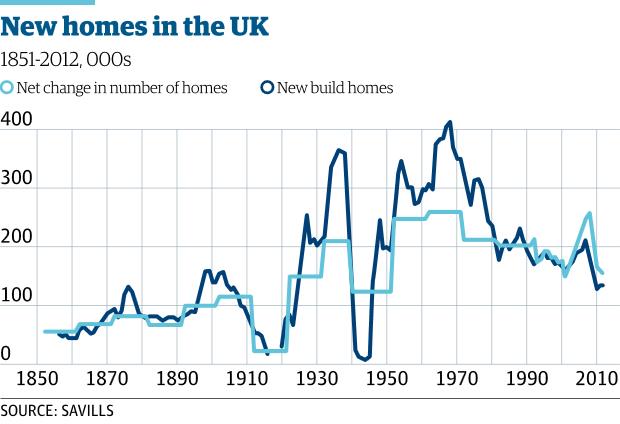
Graph shows the number of homes built and the number of new homes added to the housing stock once demolitions are taken into account
According to the housing charity Shelter, England needs 250,000 homes a year to keep up with growing demand. It said this should be made up of 125,000 homes sold at the market rate, 50,000 “intermediate” homes – including those at an affordable rent and shared-ownership homes, and 75,000 homes for social renters.
Campbell Robb, Shelter’s chief executive, said: “We are seeing a three-fold crisis in housebuilding at the moment. The number of homes being built is less than half of the 250,0000 needed each year just to meet demand, and within that, the amount of so-called affordable housing has also fallen sharply. But what’s most concerning is the drop in social housing – which has plummeted by over two-thirds since 2010. If these trends continue, there’ll be nothing left that’s affordable for people on ordinary incomes.”
Housing completions in England increased in the third quarter to 31,130, of which 24,280 homes were built by private companies. Over the same period, new housing starts fell, to 33,000, of which the majority were also by private developers.
Building figures tell half the story, but the net change in the number of homes is more critical. This takes into account both conversions and demolitions. Neal Hudson, a housing market expert at property firm Savills who provided the data for this chart, said: “You hear a lot of about building levels in the 1930s but at the same time they were clearing a lot of substandard housing stock – all of the tenements and slums.” With this in mind, the 50s, 60s and run-up to the recent financial crisis were years in which more homes were created.
4. Number of council homes sold off
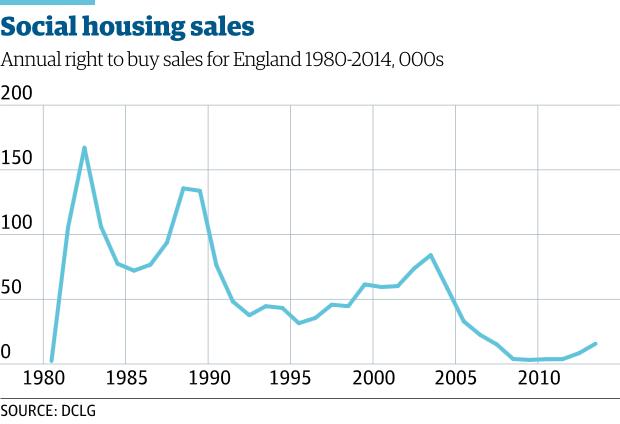
Graph shows the number of social housing flats and houses sold each year by local authorities and housing associations
Since Margaret Thatcher championed right-to-buy in the early 1980s, around 2m social houses have been sold off in England alone. Tens of thousands of properties were sold off throughout the 80s, 90s and early 2000s, and local authorities were forbidden from replacing them. To some extent, housing associations have taken their place, but affordable, social rented homes have been sold off more quickly than they have been replaced. In turn, this has meant tenants are more likely to be in private rented accommodation, making it a more attractive proposition for buy-to-let investors. The table, from DCLG and covering only England, shows how the pace of sales has picked up since the financial crisis – thanks, in part, to a rejuvenated scheme with bigger discounts, launched in 2012. In Scotland, the government has voted to end right to buy in 2016.
5. The buy-to-let boom
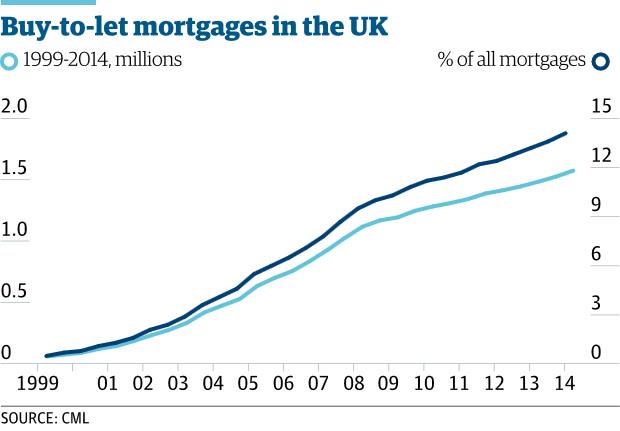
Graphic shows the number of homes built and the number of new homes added to the housing stock once demolitions are taken into account
The 1988 Housing Act brought assured shorthold tenancies into law and got rid of rent controls, making property a much easier and more attractive investment. In 1996 the Association of Residential Letting Agents (Arla) coined the phrase “buy to let” and brought together mortgage lenders who were willing to fund investment properties to develop and launch new types of loans for the new audience of buyers. In the first five years after the scheme was launched, Arla saw a 49% increase in the number of landlords doing business.
The figures from the Council of Mortgage Lenders show how much the market has grown since. In recent years, part of buy to let’s growth as a percentage of the market has been driven by a fall in the number of mortgages taken out by homeowners, but even during the downturn the number of landlord mortgages taken out each year grew. The number of outstanding buy-to-let mortgages has grown by 2,500% since the start of 1999.
Alex Hilton, director of Generation Rent, said landlords now dominated the housing market: “It’s a great investment because as you outbid first-time buyers they get trapped in the rental market, which is now worth £40bn a year. That’s £40bn people could be spending on paying off their own mortgages instead of their landlords’.”
6. Number of households in the UK
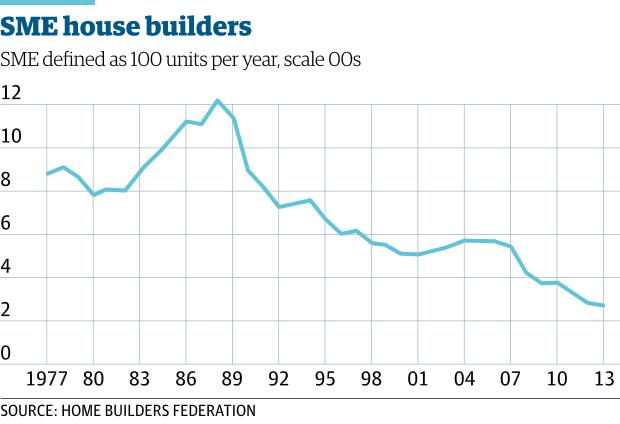
Graph shows number of UK households
The number of households that need homes has increased by around 10 million since these records began, and it is only predicted to keep growing over the coming years. In 2021 it is forecast to reach 29.1m. A growing population, together with an increase in the number of one-person households, is putting pressure on housing stock. So, too, are second homes and those that are in disrepair.
7. Number of firms building
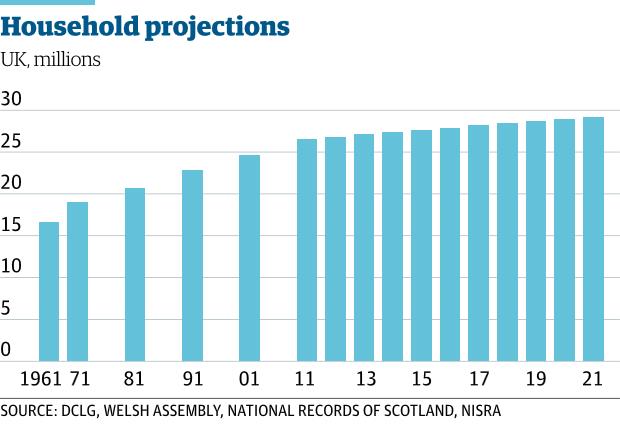
Graphic shows number of small builders operating in England and Wales
The building industry has been contracting since the late 1980s, but the financial crisis hastened the decline as small developers found it increasingly hard to raise money. Data from the Home Builders Federation shows how the number of firms in England and Wales building 100 or fewer units a year fell over the 24 years to the end of 2013.
“If we are to meet the targets set by politicians of all parties, and deliver the increases in the number of homes the country needs, it is vital we find a way of getting more smaller companies building again,” said Steve Turner of the Home Builders Federation. He said small builders would mean more building – there would be more sites and sales outlets, and they are also more likely to build on very small sites that a larger developer wouldn’t consider.
This article was amended on 12 January to clarify that local authorities were expressly forbidden from replacing social housing stock by the Thatcher government under the right-to-buy programme

